Welcome to the TAIPY Wine Dashboard, a demonstration project showcasing some capabilities of Taipy, a Python library for building interactive applications.
📚 You can find more information on how to use build Taipy apps like this one in the Medium article I wrote about it. 📚
This dashboard allows you to explore wine production data for various French wine regions, providing insights into production statistics, geographical distribution, and more. Building Business Intelligence (BI) dashboards.
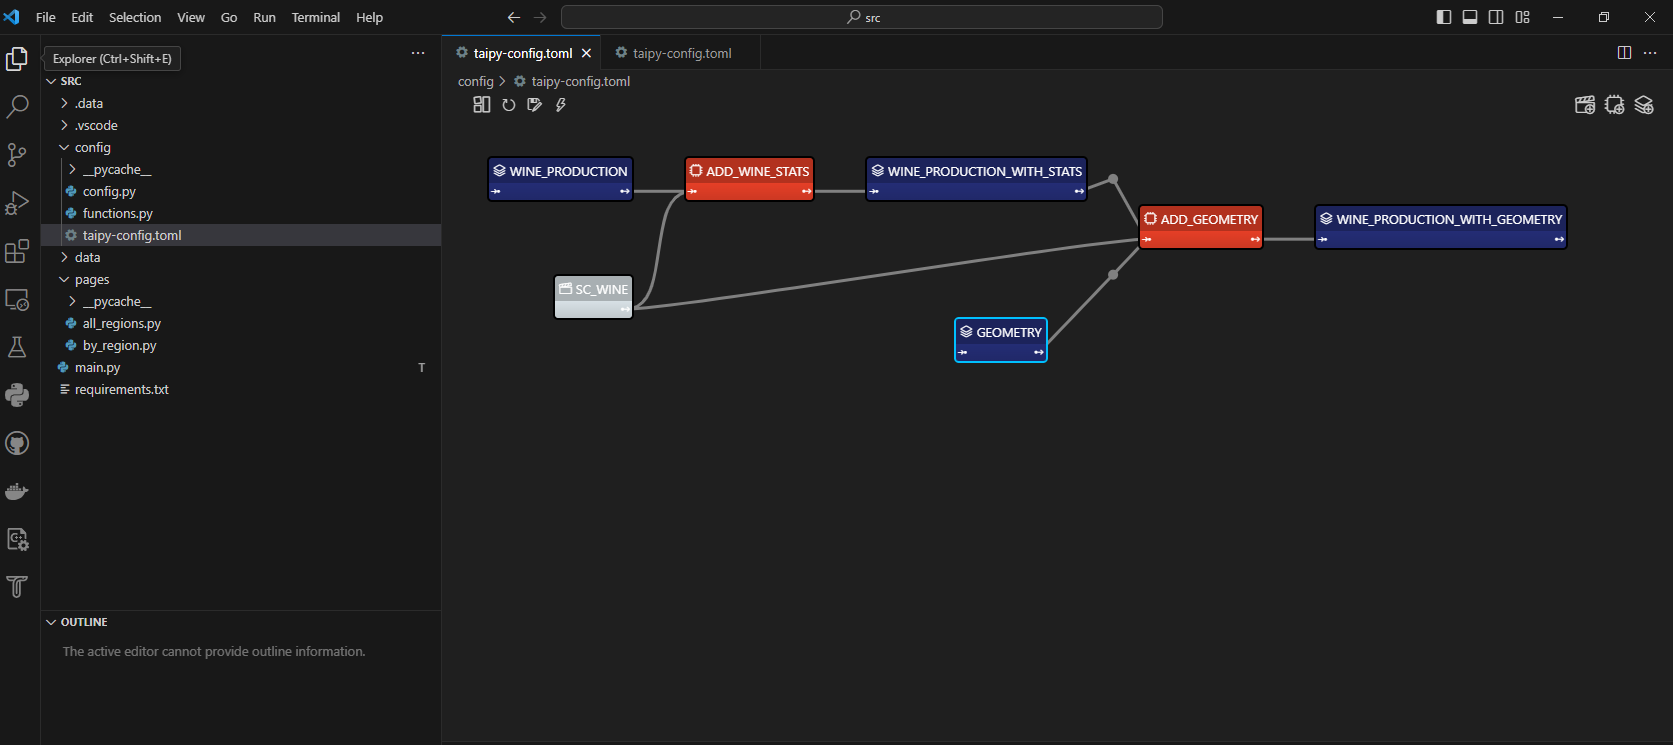
The application uses both Taipy GUI and Taipy Core. You can open the config.toml file with Taipy studio on VS Code.
-
Multi-Page Dashboard: Navigate through different pages to explore diverse aspects of wine production data.
-
Region-Based Analysis: Analyze wine production data by region, including breakdowns for red, white, and rose wines.
-
Geographical Mapping: Visualize wine production on a map, with color-coded markers representing different wine types.
-
Dynamic Data Updates: The dashboard dynamically updates data based on the selected year and area type.
Ensure you have the required dependencies installed. You can install them using the following:
pip install -r requirements.txtThe app uses Pandas and GeoPandas Python libraries.
You can download the CSV data from Kaggle. The source data is actually a pdf file from a French public organism that does some statistics about agriculture. I explained how to get the data in my personal blog.
The centroids come from another file that I also listed on Kaggle, and that file comes from official data from the French Government. This notebook shows how I created the centroids.


