Introduction
Prerequisites
If on Windows 10 it's recommended to use WSL2 + Ubuntu.
Azure CLI
Powershell
This should only be required if you are on a Mac or on LInux.
Terraform
Azure CLI Extensions
az extension add --name monitor-control-service
az extension add --name log-analytics
Powershell Cmdlets
[Optional] If you want to call Azure Monitor/Compute from Powershell install the following:
# In Powershell (type pwsh on mac)
Install-Module Az.Monitor
Install-Module Az.Compute
Instructions
Deploy via Terraform
Edit/create the deployment/dev.tfvars with:
windows_vm_count = 2
linux_vm_count = 2
windows_admin_password = "REPLACE_ME"

The above will naturally create two Windows and two Linux VMs.
cd deployment
touch dev.tfvars
terraform init
terraform plan --var-file dev.tfvars
terraform apply --auto-approve --var-file dev.tfvars
Once applied terraform will output commands for logging into the VMs, see the deployment/output.tf for reference.
Note that the deployment/variables.tf contains defaults for each required variable except the Windows admin password.
SSH to Linux VM
# Replace vmIp with the public IP of the VM
ssh -i ~/.ssh/id_rsa adminuser@vmIp
Note: The above ssh command is output as part of terraform output so you can copy and paste from your terminal. Alternatively to get the ip of the VM use: az vm list-ip-addresses --name vmName --resource-group ama_test --out table.
RDP to Windows VM
The output will contain Powershell commands to RDP into each windows VM, if you lost the output buffer just type tf output.
Note that the Powershell command will only work in Windows, not linux or mac. For mac you'll need to download the rdp file form the Azure Portal for the VM itself.
Linux Stress test
For each Linux VM you can ssh in and type:
stress --cpu 2 --timeout 60Windows Stress test
There are no good reputable packages for CPU stress testing from the command line that can be automated with Terraform. The best recommendation here is to RDP into the Windows VMs, download and install CpuStres and execute a stress test manually.
View the CPU Spike
First let's verify we can execute a query against the workspace:
az monitor log-analytics query -w "$(az monitor log-analytics workspace list -g ama_test | jq -r '.[0].customerId')" --analytics-query "Heartbeat | where TimeGenerated > ago(1h) | summarize count() by Computer"You should see something like:
[
  {
    "Computer": "linux-vm-0",
    "TableName": "PrimaryResult",
    "count_": "57"
  },
  {
    "Computer": "linux-vm-1",
    "TableName": "PrimaryResult",
    "count_": "58"
  },
  {
    "Computer": "windows-vm-1",
    "TableName": "PrimaryResult",
    "count_": "59"
  },
  {
    "Computer": "windows-vm-0",
    "TableName": "PrimaryResult",
    "count_": "59"
  }
]
Now let's look at the CPU spike we produced earlier.
az monitor log-analytics query -w "$(az monitor log-analytics workspace list -g ama_test | jq -r '.[0].customerId')" --analytics-query "Perf | where TimeGenerated > ago(1h) | where CounterName == \"% Processor Time\" | where ObjectName == \"Processor\" | summarize sum(CounterValue) by bin(TimeGenerated, 1min), Computer, _ResourceId | render timechart"This will return quite a bit of data, so it's generally recommended to run this in the Azure Portal in the Log Analytics Workspace. Open up the Log Analytics workspace -> Logs, and C&P in:
Perf
| where TimeGenerated > ago(1h)
| where CounterName == "% Processor Time"
| where ObjectName == "Processor"
| summarize sum(CounterValue) by bin(TimeGenerated, 1min), Computer, _ResourceId
| render timechart
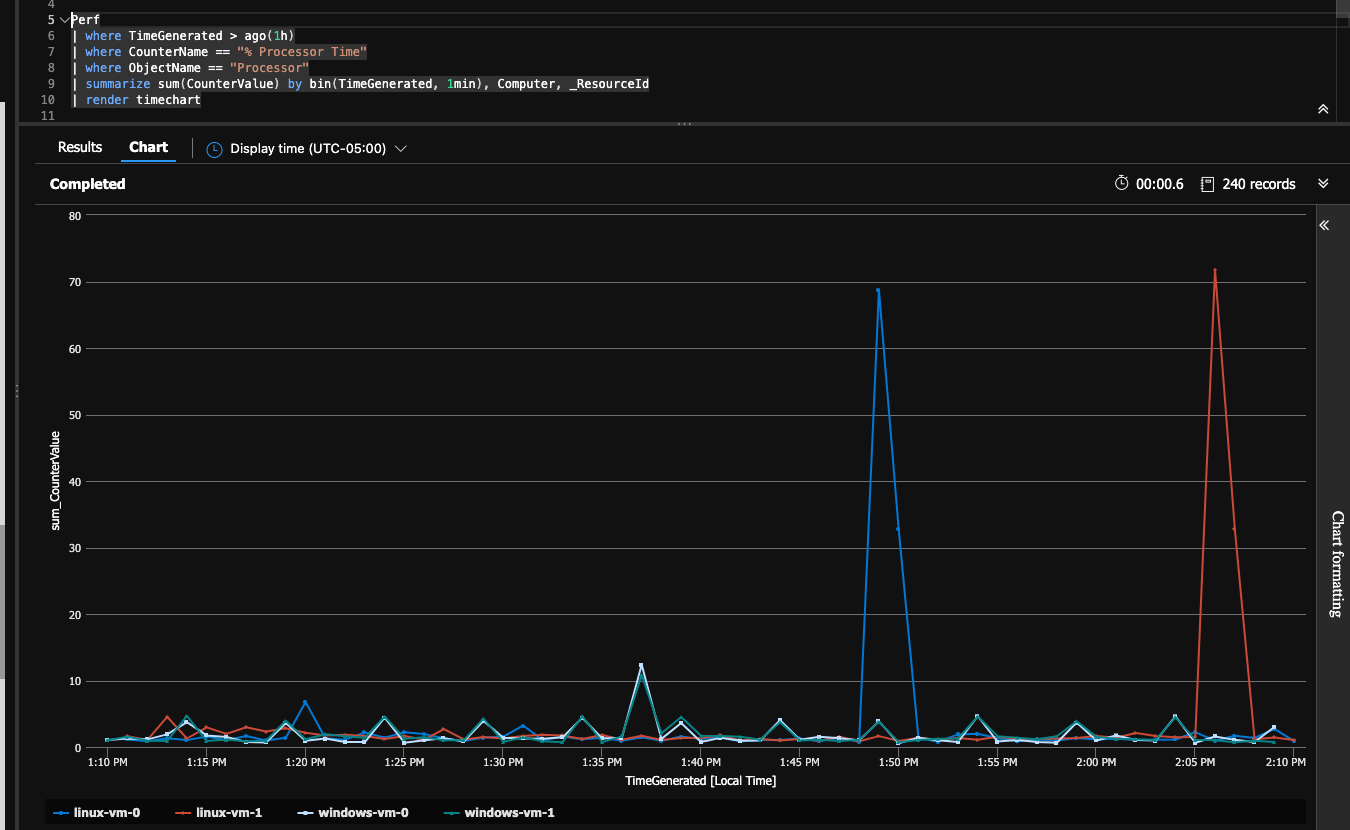
When doing that you'll see:
You can see in the above query I spiked the cpu independenly on the linux-vm-0 and on the linux-vm-1 after that.
Useful Commands
# Show public key for server
az vm show -g ama_test --name samuel-linux-1 --query "osProfile.linuxConfiguration.ssh.publicKeys[0].keyData"

# Reset public key
az vm user update -g ama_test --name samuel-linux-1 --username azureuser --ssh-key-value ~/.ssh/id_rsa.pub

# See Azure Monitor versions
az vm extension image list --location eastus2 -o table | grep AzureMonitorLinuxAgent
Unknowns
In the templates/dcr.test.json an error is thrown "Operation returned an invalid status code 'BadRequest'" if I include the following in the performanceCounters.streams:
  "Microsoft-Syslog",
  "Microsoft-Event",
