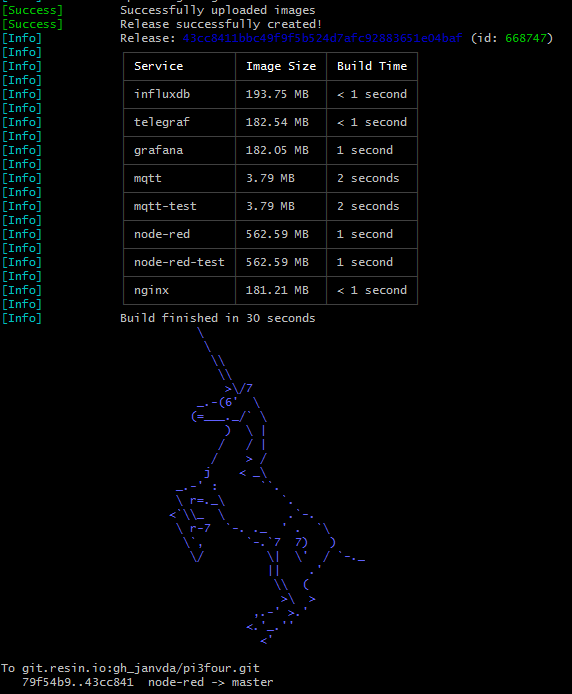
Composite docker application with "8" containers (2x Node-RED, 2x MQTT broker, Telegraf, InfluxDb, Grafana, Nginx) deployed on Raspberry Pi through Balena.
This project is actually a proof of concept to demonstrate the following features:
- The ability to run many containers on a Raspberry Pi 3 Model B+ (see section 1. What).
- The Built and Deployment of this multi container application using the BalenaCloud services (see section 2. How to install ...).
- Monitoring the system resources of the raspberry pi using the TIG stack (see section 3. System resource monitoring ...):
- That Grafana is very nice and powerful tool to create dashboards (see section 4. Grafana) and that it is easy to create or update those dashboards (see section 4.1 Updating and adding ...).
- It is possible to run multiple Node-RED instances on the same device (see section 5. Node-RED).
- It is possible to run multiple MQTT brokers on the same device (see section 6. MQTT brokers).
- A USB memory stick connected to the pi can be used for storing specific data (in this case it is the influxdb data) (see section 7. USB memory stick).
- It is possible to access the Grafana user interface and the 2 Node-RED editors via the internet (see see section 8. Internet Access).
This github repository describes a composite docker application consisting of "8" containers that can be deployed through BalenaCloud on any arm device (e.g. a Raspberry Pi 3 Model B+) running the balena OS.
So, this application consists of the following 8 docker containers (= TIG stack + 2x Node-RED + 2x MQTT broker + Nginx )
- Telegraf - agent for collecting and reporting metrics and events
- Influxdb - Time Series Database
- Grafana - create, explore and share dashboards
- 2x Node-RED - flow based programming for the Internet of Things (accessible through path
/nodered) - 2x MQTT-broker - lightweight message broker
- nginx - is open source software for web serving, reverse proxying, caching, load balancing,....
It is very easy to install this application using the BalenaCloud services through following steps:
- Balena Setup: you need a BalenaCloud account and your edge device must be running the BalenaOs. You also need to create an application in your balena dashboard and associate your edge device to it (see balena documentation).
- clone this github repository (this can be done on any device where git is installed) through the following command
git clone https://github.com/janvda/balena-node-red-mqtt-nginx-TIG-stack.git(instead of directly cloning the repository it migh be better to fork the github repository and then clone this forked repository). - Move into this repository by command
cd balena-edge-device-monitoring - Add balena git remote endpoint by running a command like
git remote add balena <USERNAME>@git.www.balena.io:<USERNAME>/<APPNAME>.git - push the repository to balena by the command
git push balena master(maybe you need to add the option--forcethe first time you are deploying).
The system resource monitoring is realized by the TIG stack and happens as follows:
- The Telegraf container collects the system resource metrics (memory, CPU, disk, network, ...) of the raspberry pi device and sends them to
- the Influxdb container that will store them in the influx database.
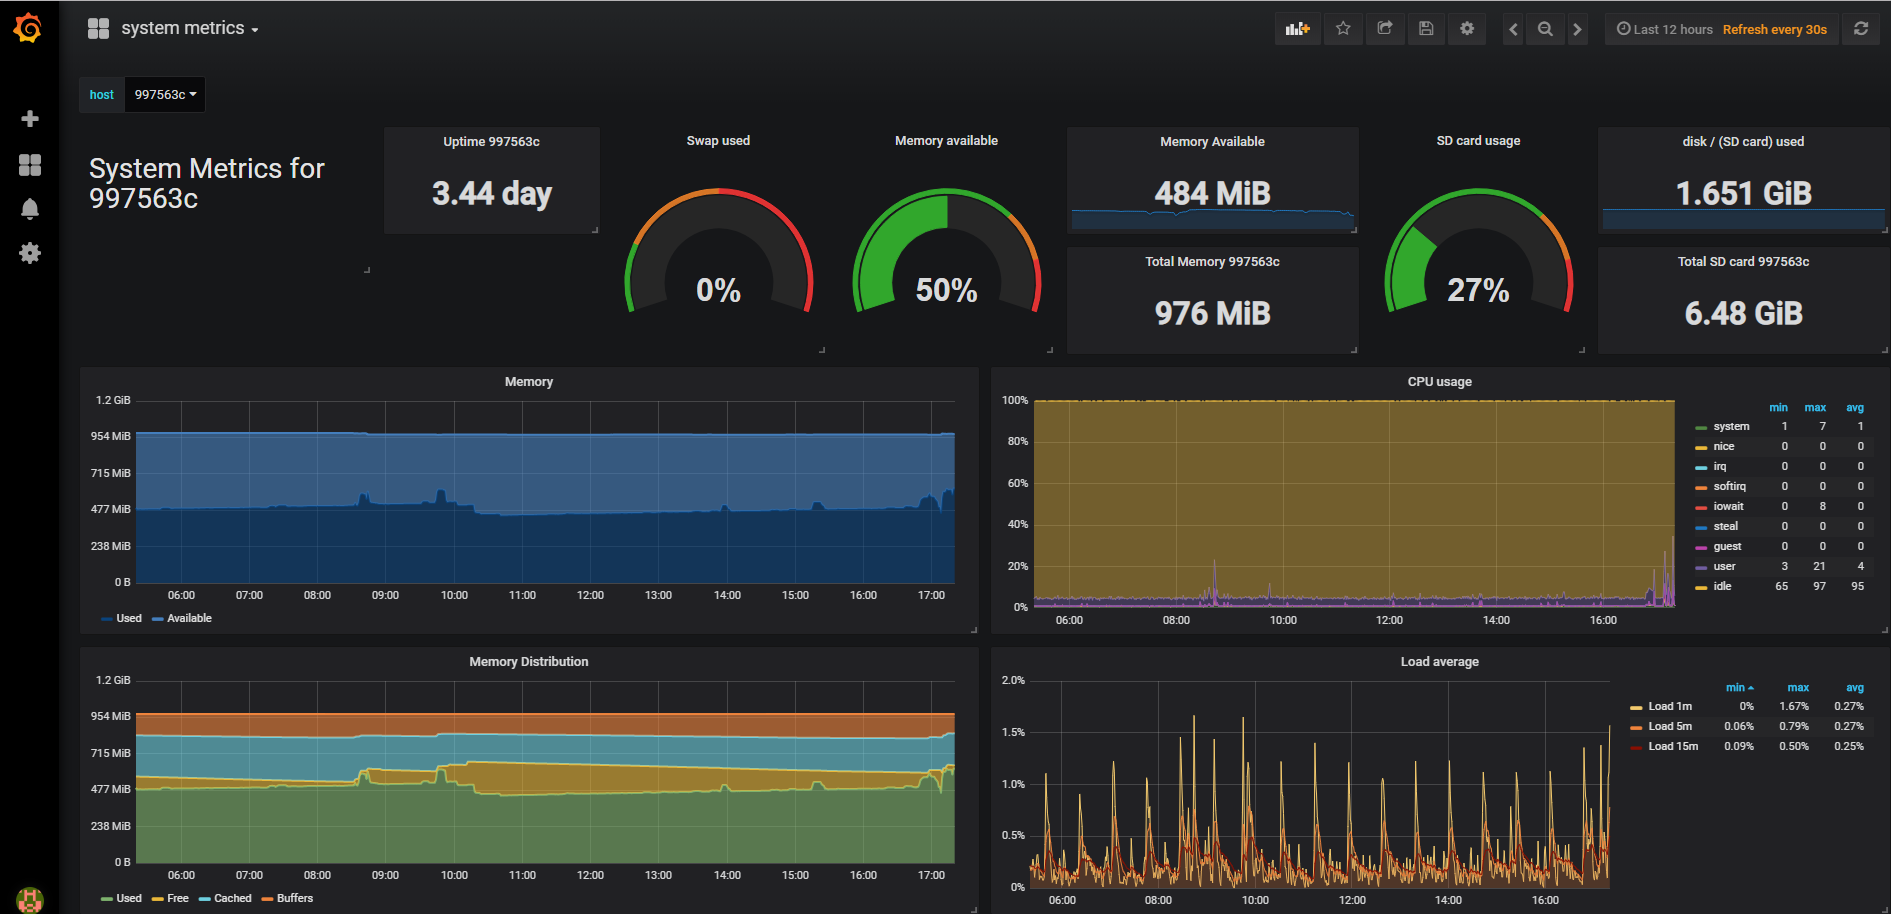
- The Grafana container has a dashboard (see screenshot below) showing these system metrics that it has retrieved from the influxdb.
The table below specifies the environment variables that can be set in the Balena Device Service Variables panel for the Telegraf Service. Note that the Default Value is defined in docker-compose.yml
| Name | Default Value | Description |
|---|---|---|
| interval | 60s |
Frequency at which metrics are collected |
| flush_interval | 60s |
Flushing interval (should not set < interval) |
The Grafana user interface can be accessed at port 3000 of the host OS.
The login and password is admin.
The name of the dashboard is system metrics.
Here below a screenshot of the system metrics dashboard that is also provisioned by this application ( file is grafana\dashboards\system metrics.json)
If you want to add a new Grafana dashboard then this can be done through following steps (Updating an existing dashboard can be done in a similar way):
- Create the new dashboard using the Grafana UI.
- From the settings menu in Grafana UI select
View JSONand copy the complete json file (don't use the grafana UIexportfeature as this will template the datasource and will not work due to that). - Save the json contents you have copied in previous step into a new file in folder
grafana\dashboardswith extension .json (e.g.mydashboard-02.json) - Substitute the ID number you can find in that file just after field
"graphTooltip"bynull. E.g."id": 1,should be changed into"id": null, - Commit your changes in git and push them to your balena git remote endpoint (
git push balena master)
The application consists of 2 Node-RED containers:
- node-red: its editor is accessble through Host OS port and path :
<Host OS>:1880/node-red/ - node-red-test : its editor is accessble through Host OS port and path :
<Host OS>:1882/node-red-test/
Note that both Node-RED editors are protected by a user name and a hashed password that must be set through the environment variables USERNAME and PASSWORD. The Node-RED security page describes how a password hash can be generated. You can set these environment variables using your Balena dashboard either under:
- Application Environment Variables (E(X)) - this implies that both Node-RED instances will have the same username and password.
- Service Variables (S(X))
Notes:
node-red-dataandnode-red-test-dataare 2 named volumed used for the\datafolder of respectively node-red and node-red-test. Take care that thesettings.jsis only copied during the initial deployment of the application. So when the application is redeployed e.g. due to changes, then thesettings.jsis not recopied to the\datafolder. (see also How to copy a file to a named volume?)- In order to assure that nodes installed through
npm installare not lost after a restart of the container, you must assure that they are installed in the\datadirectory. So you must first do acd \dataand then execute thenpm install ....command. This will assure that the node is correctly installed under folder\data\node_modules\and that it will persist after restarts of the container.
This application consist of 2 Mosquitto MQTT-brokers:
- mqtt which is listening to Host OS port 1883
- mqtt-test which is listening to Host OS port 1884
The data of the influxdb will be stored in the mount location \mnt\influxdb.
The influxdb container is configured (see Dockerfile and my_entrypoint.sh) so that a USB drive (e.g. a USB memory stick) with label influxdb will be mounted to this mount location. It is currently also expecting (see Dockerfile) that this USB drive is formatted in ext4 format.
If no USB drive (or memory stick) with label influxdb is connected to the raspberry pi then the named volume influxdb-data will be mounted to this location as is specified in the docker-compose.yml file.
Notes
- the current Balena version doesn't yet support the definition of a volume for such a mounted drive in the docker compose yaml file therefore this is handled through the influxdb container setup as described here above.
- It is not possible to mount the same USB drive also in telegraf container (I have tried that) and consequently telegraf is not able to report the
diskmetrics for this USB drive.
The nginx container has been configured so that when you enable the Balena public device URL that you can access the following applications over the internet:
- Grafana User Interface via
<public device URL> - Node-RED editor of the container node-red via
<public device URL>\node-red - Node-Red dashboard UI of the container node-red via
<public device URL>\node-red\ui - Node-RED editor of the container node-red-test via
<public device URL>\node-red-test - Node-RED dashboard UI of the container node-red-test via
<public device URL>\node-red-test\ui
In case you get a 502 Bad Gatewayerror or a message like Cannot GET /node-red-test/ when trying to access the above public URLs then this might be fixed by restarting the nginx container !


