ringbp is an R package that provides methods to simulate infectious disease transmission in the presence of contact tracing. It was initially developed to support a paper written in early 2020 to assess the feasibility of controlling COVID-19. For more details on the methods implemented here, see the associated paper.
The current development version of ringbp can be installed from
GitHub using the pak package.
if(!require("pak")) install.packages("pak")
pak::pak("epiforecasts/ringbp")The main functionality of the package is in the scenario_sim()
function. Here is an example for running 10 simulations of a given
scenario:
library("ringbp")
library("ggplot2")

res <- scenario_sim(
  n.sim = 10, ## 10 simulations
  num.initial.cases = 1, ## one initial case in each of the simulations
  prop.asym = 0, ## no asymptomatic infections
  prop.ascertain = 0.2, ## 20% probability of ascertainment by contact tracing
  cap_cases = 4500, ## don't simulate beyond 4500 infections
  cap_max_days = 350, ## don't simulate beyond 350 days
  r0isolated = 0.5, ## isolated individuals have R0 of 0.5
  r0community = 2.5, ## non-isolated individuals have R0 of 2.5
  disp.com = 0.16, ## dispersion parameter in the community
  disp.iso = 1, ## dispersion  parameter of those isolated
  delay_shape = 1.651524, ## shape parameter of time from onset to isolation
  delay_scale = 4.287786, ## scale parameter of time from onset to isolation
  k = 0, ## skew of generation interval to be beyond onset of symptoms
  quarantine = FALSE ## whether quarantine is in effect
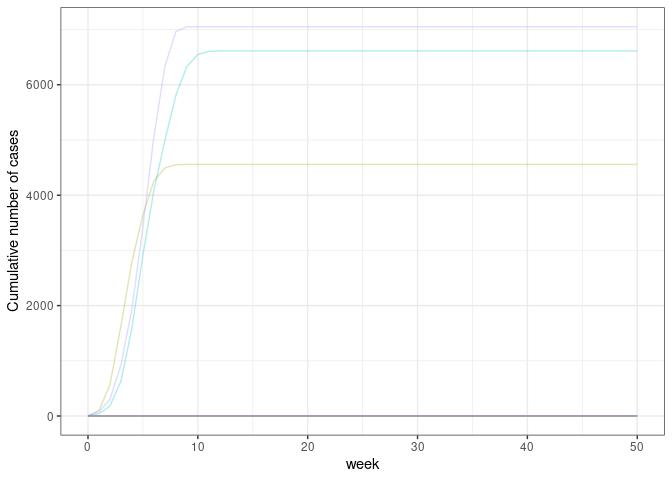
)ggplot(
data = res, aes(x = week, y = cumulative, col = as.factor(sim))
) +
geom_line(show.legend = FALSE, alpha = 0.3) +
scale_y_continuous(name = "Cumulative number of cases") +
theme_bw()extinct_prob(res, cap_cases = 4500)
#> [1] 0.7


