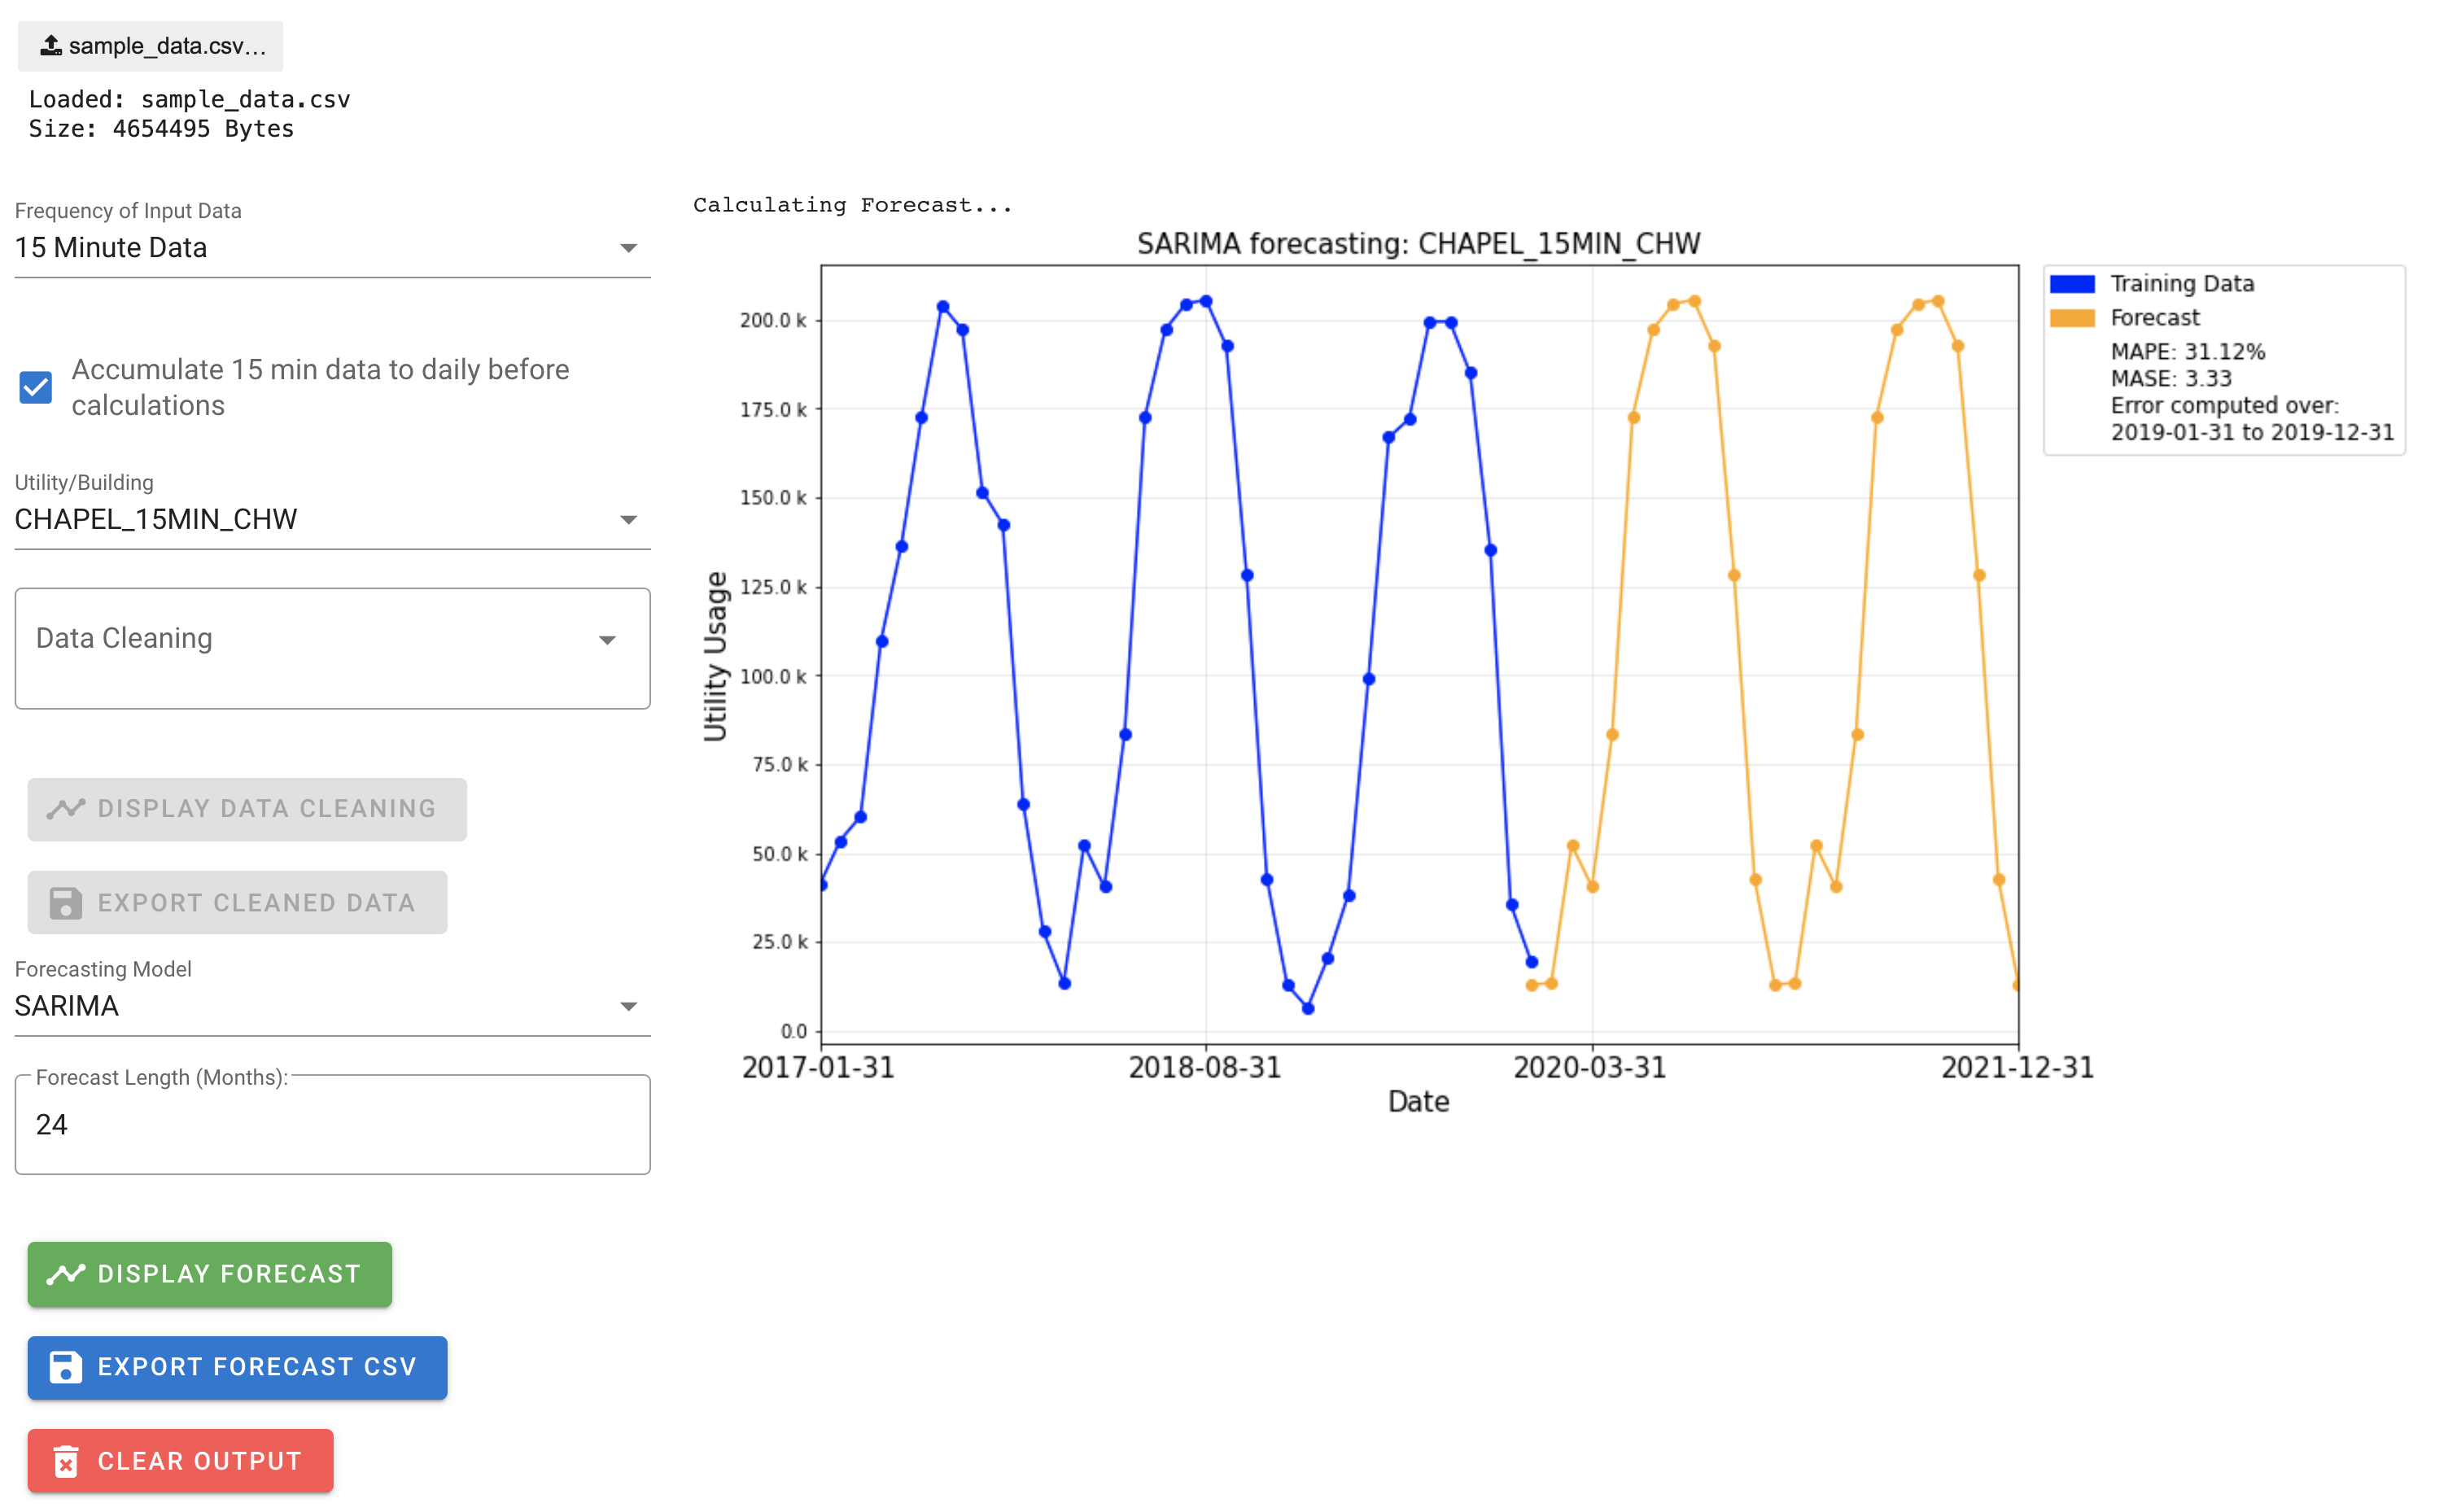
Working with Duke’s Facilities Department, we have developed a tool which allows the cleaning and forecasting of utility usage data, for use in accurate budgeting and planning of new buildings.
- You will need up-to-date python 3 and pip - see https://www.python.org/downloads/ (pip is typically included by default for Python 3.4+)
- Clone (or download) this repo:
git clone https://github.com/epswartz/utility-forecasting.git - Go into the directory and install the required packages:
cd utility-forecasting; pip install -r requirements.txt - Run:
voila Forecasting_Tool.ipynb --VoilaConfiguration.file_whitelist="['.*\.csv']" - A browser window should open displaying the tool, but if not, you can navigate to http://localhost:8866 yourself.
- You will need up-to-date python 3 and pip - see https://www.python.org/downloads/ (pip is typically included by default for Python 3.4+) make sure to check "Add Python to environment variables" - this checkbox is under Advanced Options.
- Clone (or download) this repo:
git clone https://github.com/epswartz/utility-forecasting.git - Go into the directory and install the required packages:
cd utility-forecasting; pip install -r requirements.txt - Unfortunately, voila does not work well with Windows. Instead of running voila, run:
python -m notebook Forecasting_Tool.ipynb - At the top of the notebook, click Kernel-> Restart & Run All. This may take a second to load, but you will see the tool appear at the bottom of the Jupyter notebook.
Note: Windows will sometimes download files as .xls, so rename to have the file extension be .csv which will show the data in the correct format
Input an excel file with first column labelled as dt representing the time/ date the data was recorded and the rest of the columns hold different building's data.
%m/%d/%y %I:%M %p%y-%m-%d%y/%m/%d%y-%m%y/%m
Sample data is provided in the sample_data folder. All of the sample data is raw (no cleaning has been done). To use this sample data upload it into the tool and select the matching frequency from the Frequency of Input Data dropdown. It's recommended to use aggregation at the daily level or higher for faster runtimes.
- Ethan Swartzentruber
- Grace Llewellyn
- Shota Takeshima
- Billy Carson
- John Haws, Duke OIT
- Gagan Kaur, Duke OIT
- Wendy Lesesne, Duke FMD
- Casey Collins, Duke FMD
