Extending Olivia Walch's (@ojwalch) sleep_classifiers using neural networks.
If you're looking for Jupyter Notebooks containing the ML models, check out the notebooks folder. If you're interested in ETL/feature extraction and engineering, look at source/etl.py. Methods for training and evaluating our models are in source/evaluator.py. These generally assume you have already extracted the data from Dr. Walch's study into the data folder of the project root directory (directory where this README lives).
Project Overview: Olivia and I use spectrograms derived from triaxial accelerometer data, from the aforementioned sleep_classifiers, as training data for several machine learning techniques with the goal of predicting sleep stages. After our initial focus on accurate prediction of Awake/Asleep, we are extending our techniques to three and four sleep stage prediction.
Our best results came from convolutional neural networks incorporating a time feature after their convolutional layers. For comparison, we also explored pure feedforward neural networks (with and without the time feature), along with some logistic regression models; see the notebooks folder.
Spectrograms are used to study the frequencies correlated most strongly with a signal over time via short-time Fourier transforms (STFTs): taking Fourier transforms of the signal in a progressive temporal window. When plotted with time on the horizontal axis and frequency on the vertical axis, we visualize these Fourier transform windows as spectrograms. We used SciPy's signal.stft to create our spectrograms from the triaxial accelerometer data. These are input as black-and-white images to the neural networks.
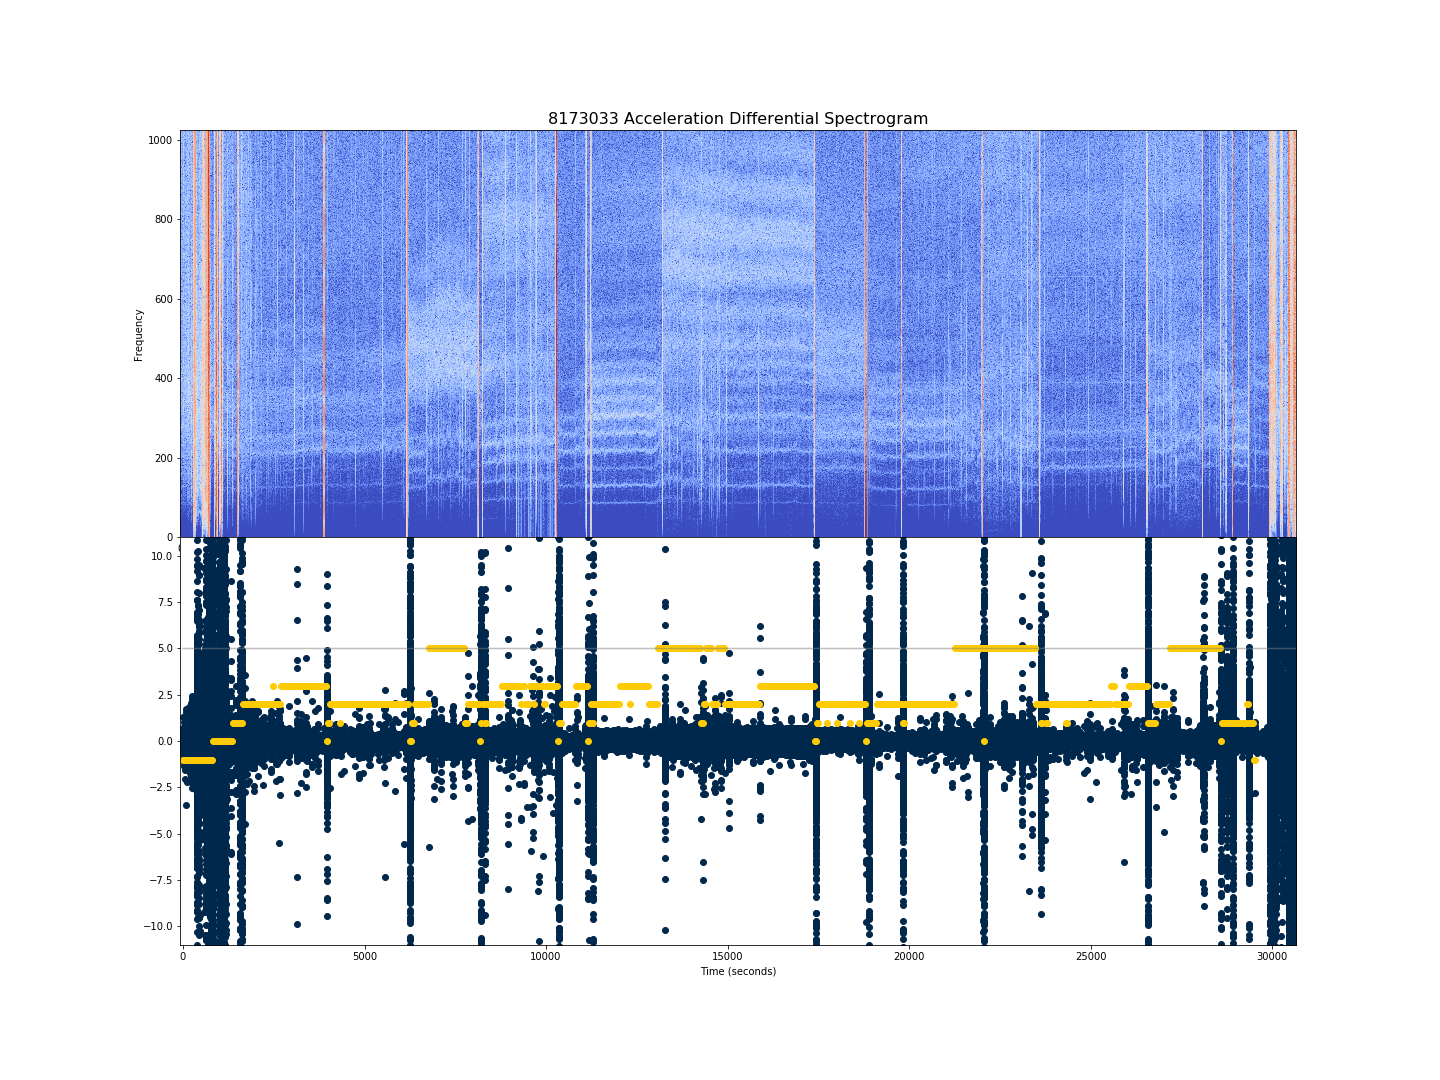
To give some idea for the information contained in these, below is a spectrogram (top) generated using Python's Librosa library, along with the derivative of acceleration (in blue) and PSG labels (in maize) on the bottom. The highest PSG label of 5 corresonds to REM sleep; awake is class 0; NREM stages are classes 1, 2, 3, 4.
