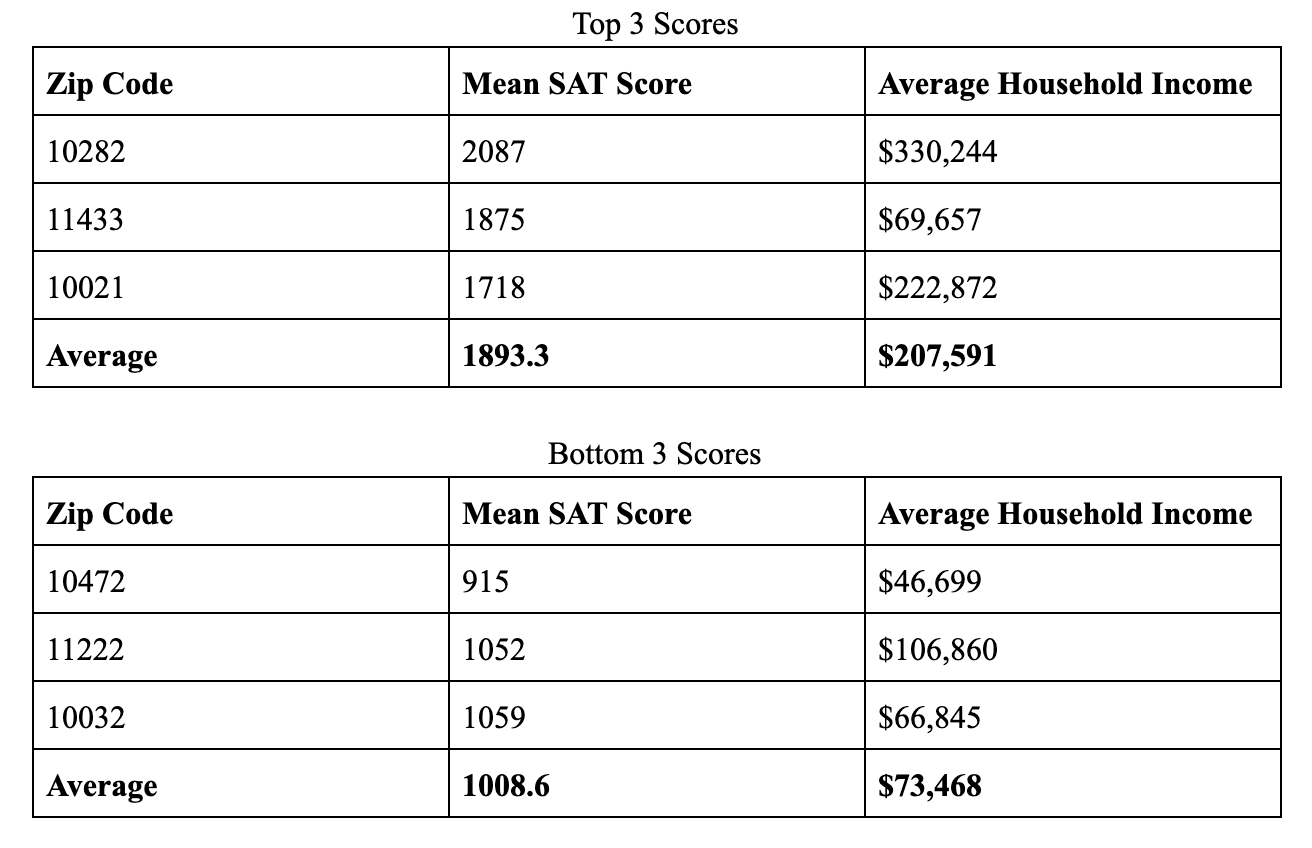
With this project I am looking to investigate the relationship between NYC school zip codes, household income, and mean SAT scores. I will do this by first importing spreadsheets containing the average SAT score and physical address for each school. Next I will join these two data tables together and group by zip code. From here I will find the mean SAT score per zip code and analyse the distribution. For the zipcodes with the top 3 highest and lowest scores I will add the average income to see if there are any patterns.
My hypothesis is certain zip codes will have significantly higher SAT scores and incomes than others.
This analysis uncovers:
- The distribution of scores is not normal and has a right skew
- Zip codes with higher mean SAT scores may likely have higher average household incomes
Given our data we can assume two things. One is that the distribution of scores is not normal and has a right skew. This variability on the right side shows that many of the high scores tend to be further from the median than the lower scores. This could suggest that the high scoring zip codes (schools) have a significant advantage over the low scoring zip codes, producing high outliers more frequently. The other assumption that we can gather from our data is that zip codes with higher mean SAT scores will have higher average household incomes. These two variables might be correlated because the more income you have, the more resources you can buy to aid in your education. These resources could include things like tutors and prep classes that give households with a higher income an advantage on tests like the SAT.
The income data gathered from incomebyzipcode.com


