I created this small website using Python Flask and PostgreSQL to take advantage of the Philadelphia RideIndego Bicycle Share program API.
I created this to familiarize myself and get comfortable with Python, as well as to have a fun personal project to learn from.
My original awareness of the existence of the Philadelphia Bike Share program came about because a bicycle share docking station was installed on the sidewalk across from my former apartment overnight, and I noticed it one morning.
I discovered that a GeoJSON API exists, which provides information about the bicycle and docks available at each of the stations on the OpenDataPhilly website:
I began graphing the data because I was very impressed by Dr. Randal Olson's blog, visualizing the data from each station:
- Visualizing Indego bike share usage patterns in Philadelphia
- Analyzing the health of Philadelphia's bike share system
- Visualizing Indego bike share usage patterns in Philadelphia, Part 2)
The API end-point that I make requests to is a GeoJSON file which lists all station data:
The data is also available in GBFS format here:
Furthermore, anonymized trip data going back since the year 2005 is available on the Indego website at:
Since the API end-point returns a very large response (including every station), I have this cron job which stores a complete copy of the HTTPS JSON response from the API every ten (10) minutes in this PostgreSQL table.
- This prevents a slow page load and response time (i.e. poor performance) on every request to my website.
- The unfortunate side effect is that I may be showing stale data, up to ten minutes old, assuming everything is working correctly.
I have been storing the data in PostgreSQL since mid-2019 and have over 202,000 rows since that time (as of mid-2023, approx. ~4 years):
indego=# select now();
             now
------------------------------
 2023-03-20 01:23:21.64833+00
(1 row)
indego=# select min(added), max(added), count(added) from indego;
              min              |              max              | count
-------------------------------+-------------------------------+--------
 2019-05-01 01:00:41.994451+00 | 2023-03-20 01:20:12.854825+00 | 202027
(1 row)

indego=#
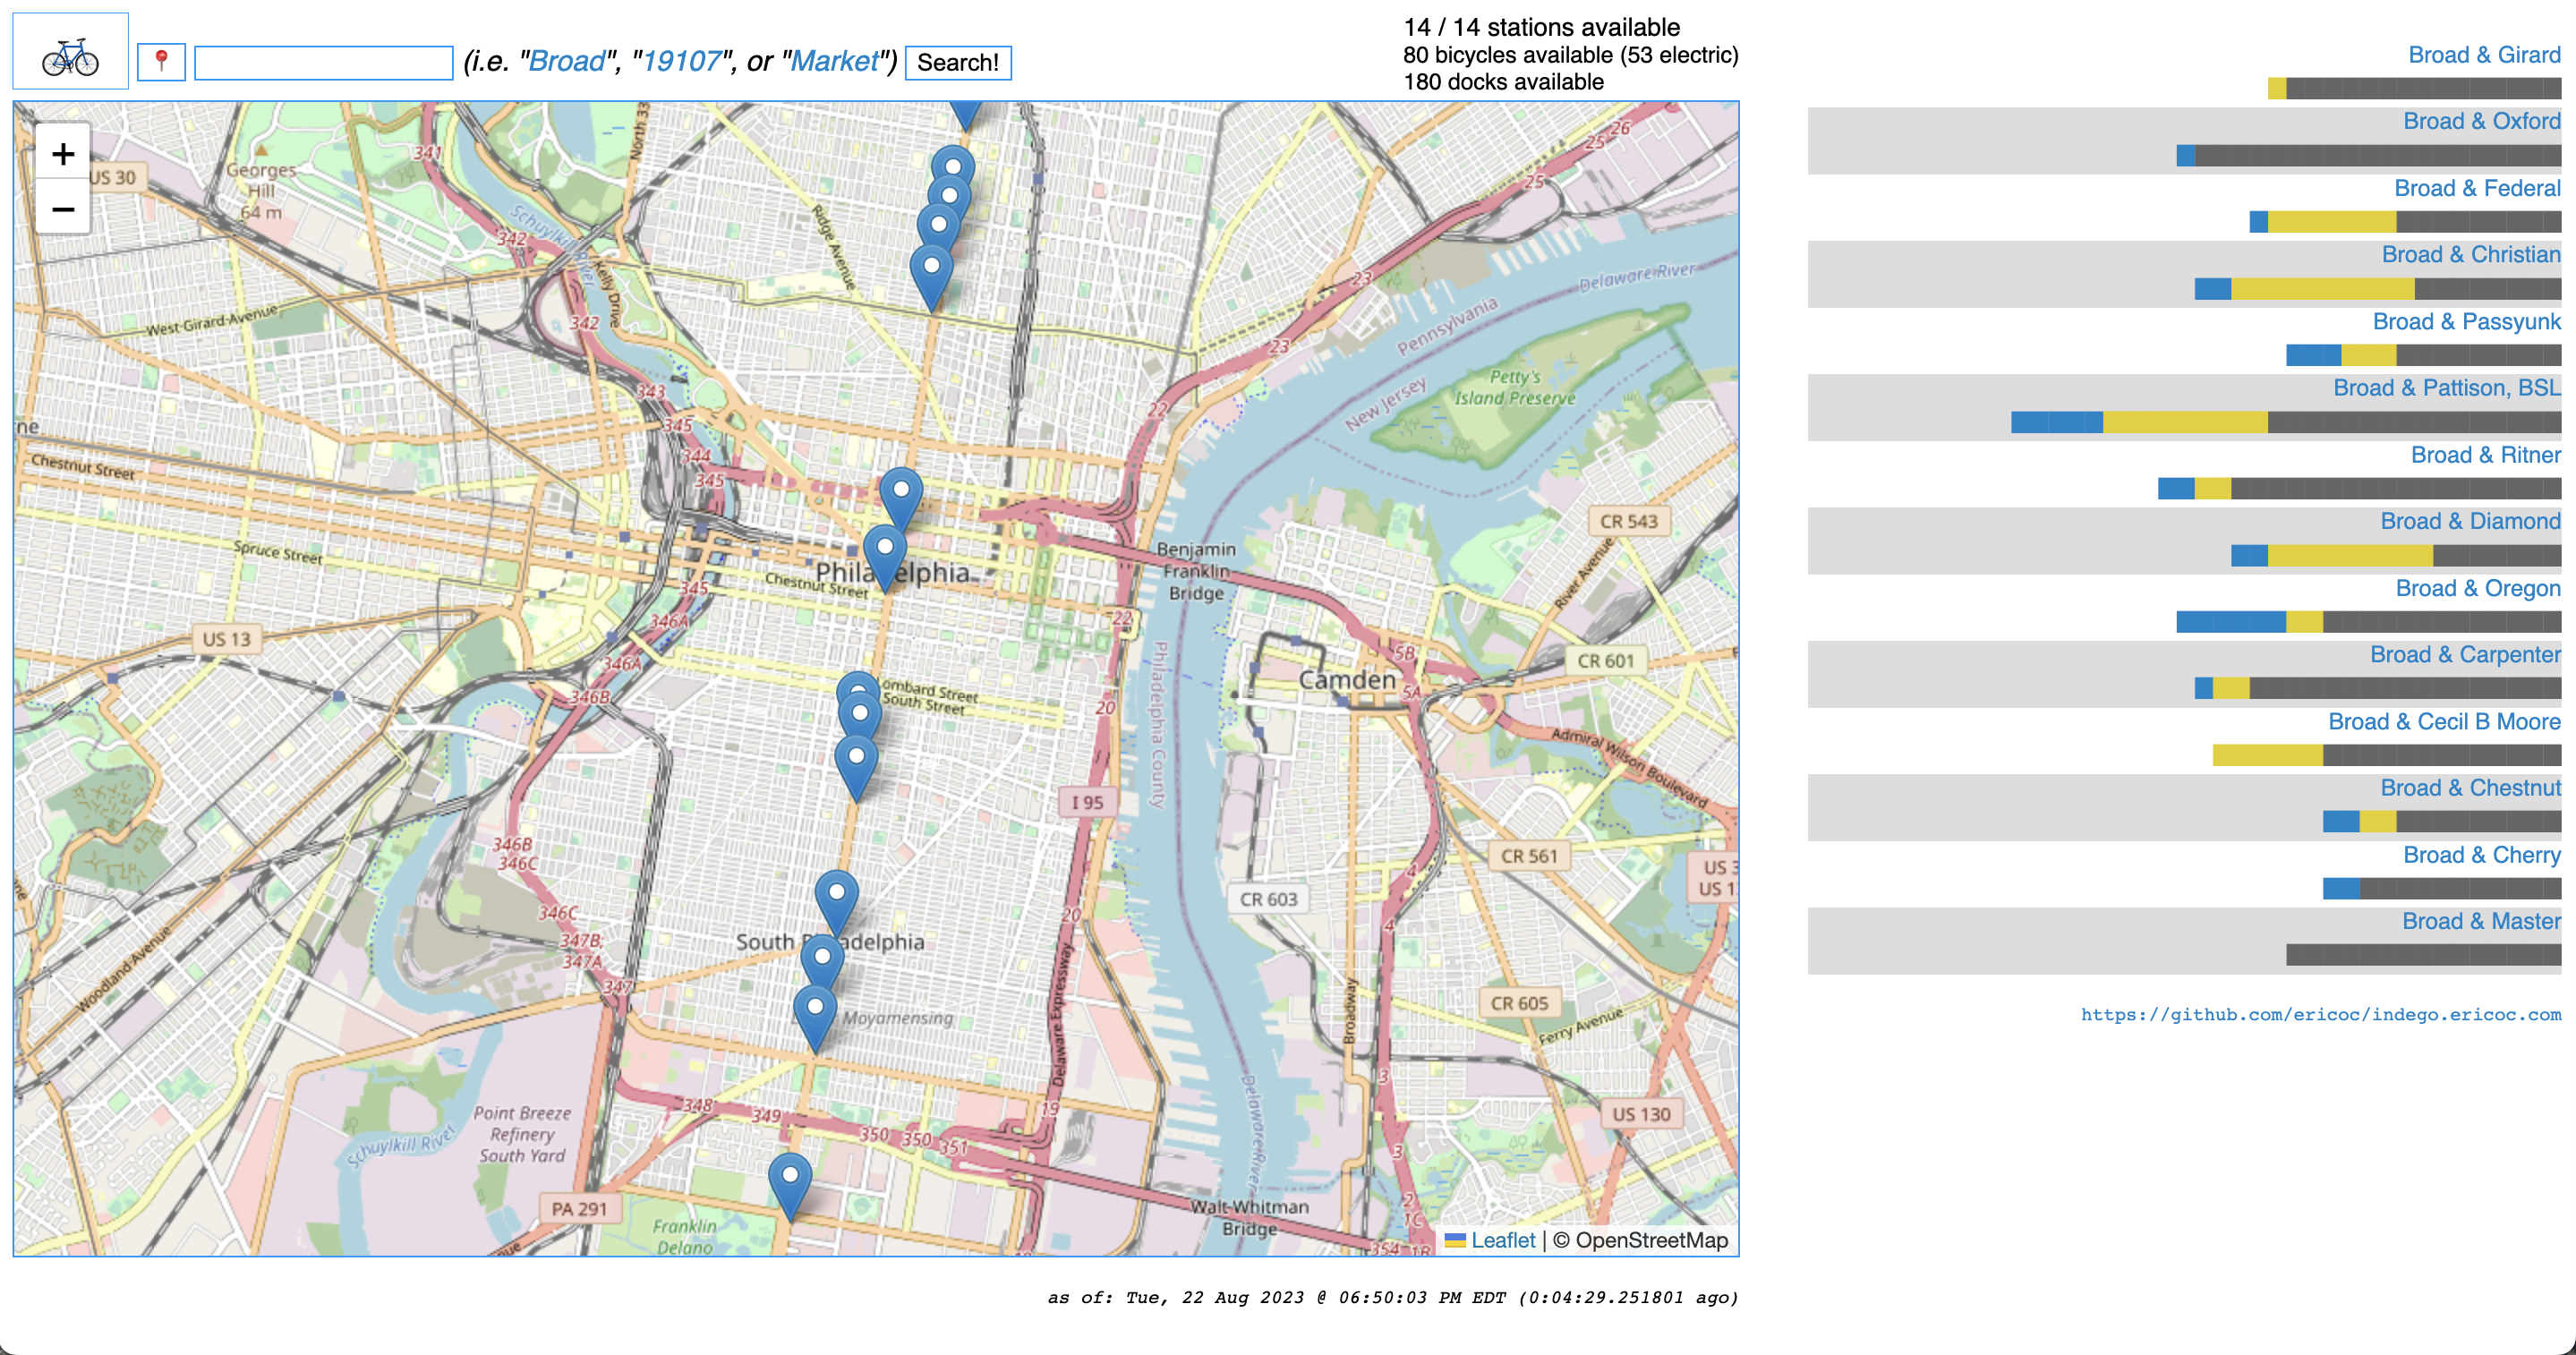
The stations are mapped using their JSON GPS coordinates, in combination with Leaflet and OpenStreetMap.
The button to locate yourself on the map relies upon the JavaScript Geolocation API:
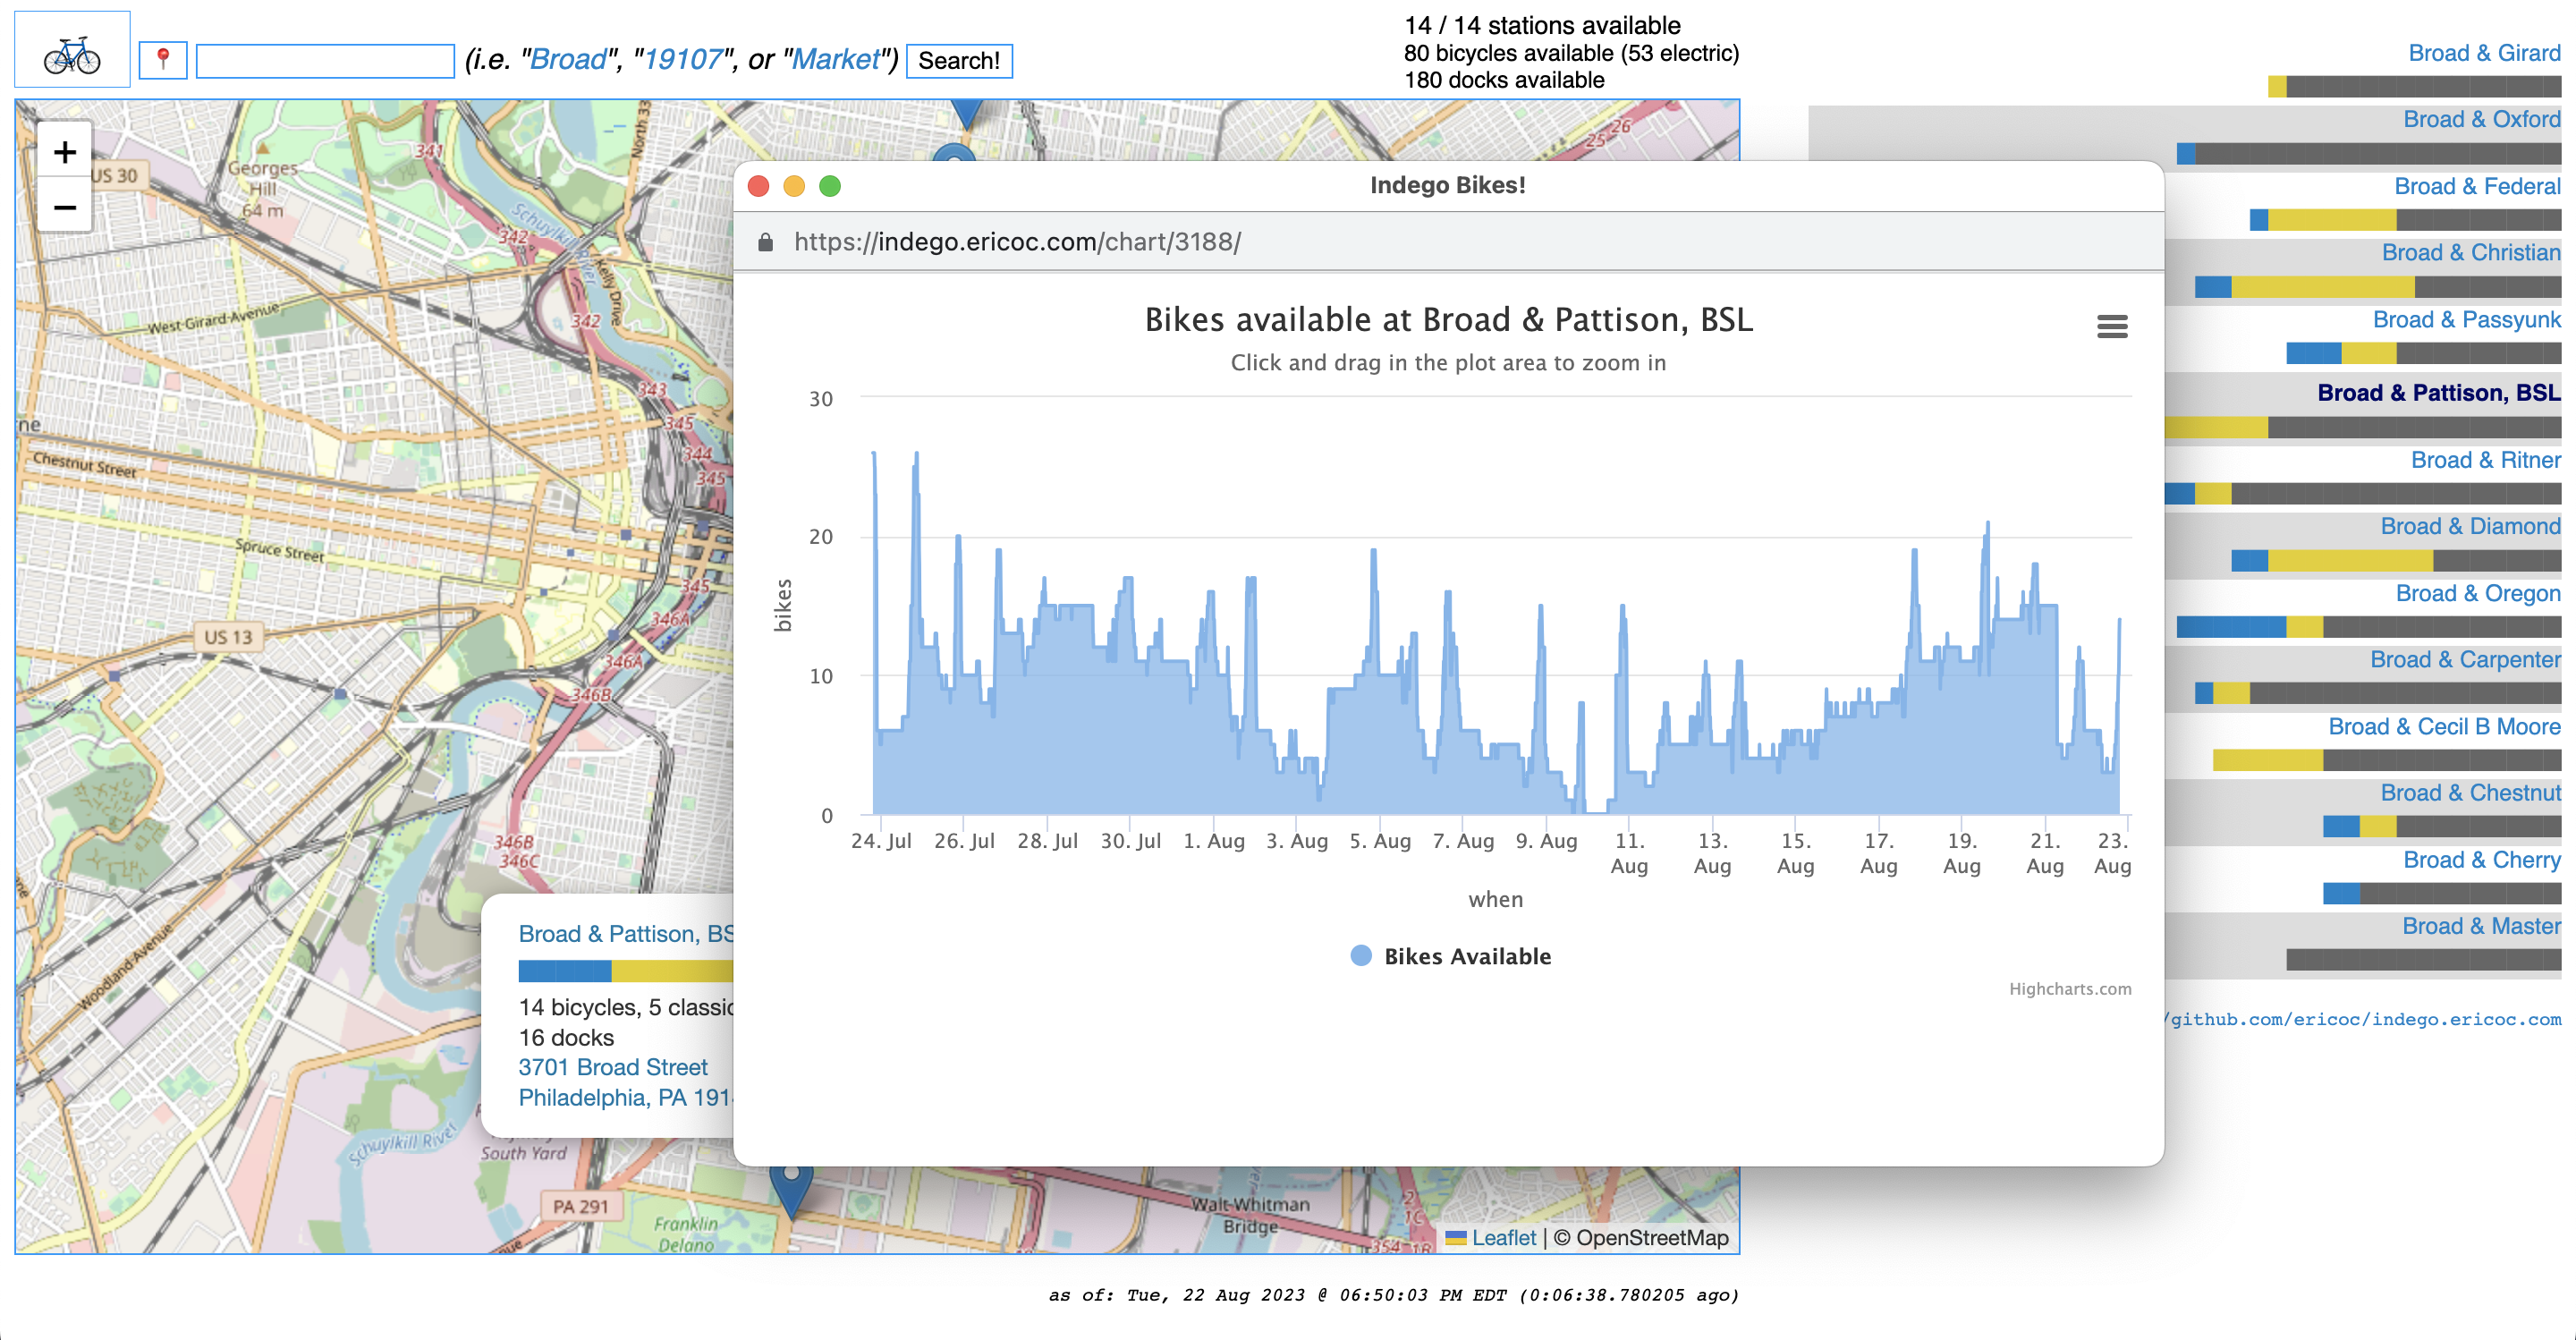
If you click on the blocky chart within one of the map marker pop-ups, you should see a new window graphing available bikes at that station for the past thirty (30) days.
- You can try it out here:
- You can even historically chart multiple stations at once:
The historic charts are created using a JavaScript library called Highcharts.
I was lucky enough to write a post for the Highcharts Blog at:
- Search results for "Broad":
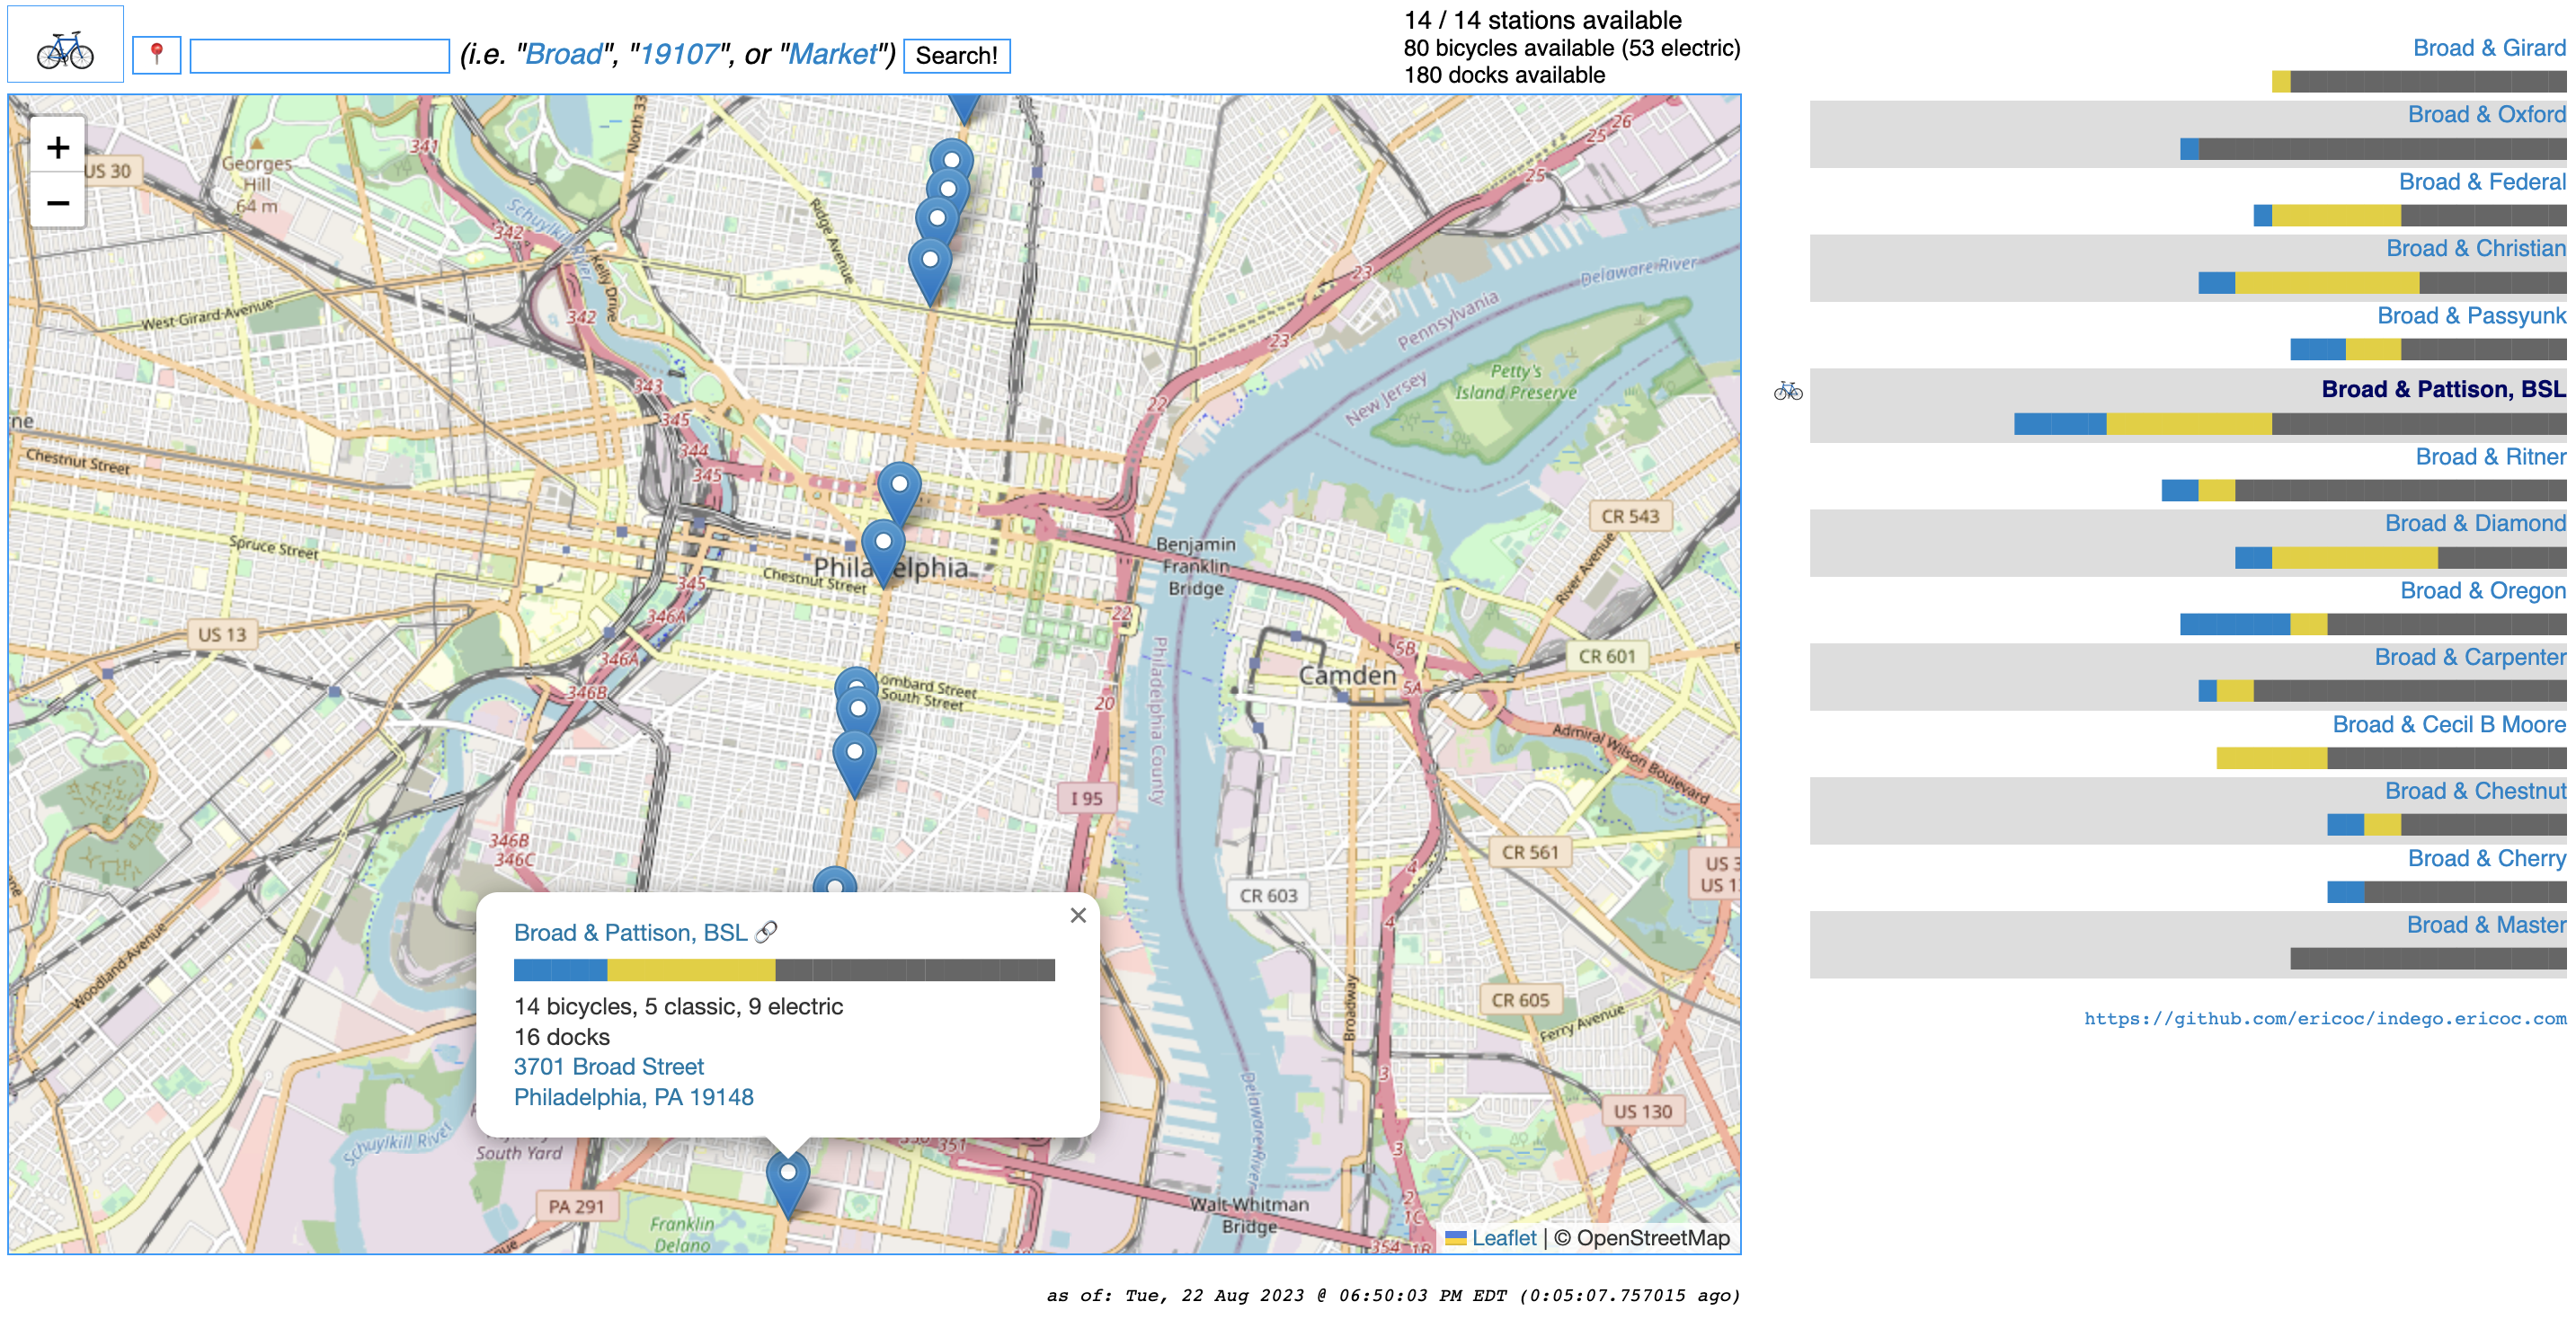
- Broad & Pattison station:
- Chart for Broad & Pattison station: