This repo contains some code used in my research project on neighborhood effects in consumption. You can download a working paper on my personal website.
Trampolines are popular among Swedish families. Thanks to their size and distinct shape, they can be detected in an aerial photo. To collect data on trampoline ownership, I apply an instance of Inception ResNet to a large set of aerial photos of Swedish neighborhoods taken between 2006 and 2018.
Each raw image is a 10,000 by 10,000 pixel GeoTIFF. As my data contains several thousand images, importing all of them into QGIS is not feasible. In geotiff_coverage.py, I extract metadata from each image and it's corresponding json meta file and collect the geographic extent of each image in a shapefile:
import fiona
from shapely.geometry import mapping, shape, box, Point
import os, os.path
from osgeo import gdal

data = gdal.Open(picFolder+file+'.tif', gdal.GA_ReadOnly)
geoTransform = data.GetGeoTransform()
minx = geoTransform[0]
maxy = geoTransform[3]
maxx = minx + geoTransform[1] * data.RasterXSize
miny = maxy + geoTransform[5] * data.RasterYSize
geom = box(minx,miny,maxx,maxy)
img_id = file[0:11]
img_year = file[12:]
yeard[picFolder+file+'.tif'] = int(img_year)
metapath = metaFolder+img_id+'_flygbild_'+img_year+'.json'

with open(metapath) as metafile:
    metadata = json.load(metafile)
    try:
        img_date = metadata['features'][0]['properties']['tidpunkt'][0:10]
        img_camera = metadata['features'][0]['properties']['kamera']
        dest.write({'geometry': mapping(geom), 'properties':{ 'FILENAME' : file,
                                                              'ID' : img_id,
                                                              'DATE': img_date,
                                                              'YEAR': img_year,
                                                              'CAMERA': img_camera}})
Using GDAL, I then create virtual mosaics (VRT) containing all the photos from a particular year. To slice each image into chips, each containing a single-family propoerty, I use administrative shapefiles containing the centroid coordinates of every building and polygons for each property parcel. From shp_preprocess.py:
BUILDING_SHP = 'by_all.shp'
LOT_SHP = 'ay_all.shp'
Using the building code field in by_all.shp, I select the subset of land parcels that intersect with a single-family home:
import fiona
from shapely.geometry import shape, mapping

TARGET_SHP = outFolder+'Lots_all_10000.shp'

maxArea = 10000

source = fiona.open(LOT_SHP, 'r', encoding='iso-8859-1')

polygons = [pol for pol in source]
points = [pt for pt in fiona.open(POINTS_SHP)]

idx = index.Index()
for pos, poly in enumerate(polygons):
    idx.insert(pos, shape(poly['geometry']).bounds)

    #iterate through points
    with fiona.open(TARGET_SHP, 'w', driver=source.driver, crs=source.crs, schema=source.schema) as dest:
        for i,pt in enumerate(points):
            point = shape(pt['geometry'])
            minArea = maxArea
            minpoly = {}
            # iterate through spatial index
            for j in idx.intersection(point.coords[0]):
                print(point.coords)
                geom = shape(polygons[j]["geometry"])
                area = geom.area
                if point.within(geom) and area < maxArea:
                    #only write smallest matching property for each point
                    if area < minArea:
                        minArea = area
                        minpoly = polygons[j]
                if len(minpoly) > 0:
                    print(pt['id'])
                    dest.write(minpoly)
With the relevant properties selected, cut_imgs.py slices the images to 300x300 pixel jpegs (about 75 by 75 meters on the ground). By iterating over the featues in TARGET_SHP created about, I apply gdalwarp to the photos with each property outlining the cut.
I also set a minimum dimension to discard lots that are too small (30 pixels corresponds to about 7.5 meters). The script also incorporates a simple rotation algorithm that attempts to fit large properties into a 300 by 300 bounding box by rotating them (the angel argument in the toJpeg function)
import fiona
from shapely.geometry import shape, box, Point
from shapely.affinity import rotate
import os, os.path
from PIL import Image
from osgeo import gdal

def toJpeg(im,filename,max_side_dim,outFolder,angle):
    size = (max_side_dim, max_side_dim)
    if angle == 0:
        background = Image.new('RGB', size, (0, 0, 0))
        background.paste(im, (int((size[0] - im.size[0]) / 2), int((size[1] - im.size[1]) / 2)))
        if background.getbbox():
            background.save(outFolder+filename+'.jpg', 'JPEG', quality = 95)
            print("Jpeg exported.")
            return 1
        else:
            print("All black!")
            return 2
     ...

min_side_dim = 30
max_side_dim = 300

with fiona.open(SOURCE_SHP, 'r') as source:
    for idx, feat in enumerate(source):
            with fiona.open(path=inFolder+"tempfile.shp", mode='w', driver=source.driver, schema=source.schema, crs=source.crs) as tempshp:
                tempshp.write(feat)
            outtile = gdal.Warp(outFolder+newfile+".tif", SOURCE_GTIFF, format = 'GTiff', cutlineDSName=inFolder+"tempfile.shp",                                         cropToCutline=True)
            outtile = None
            im = Image.open(outFolder+newfile+".tif", 'r')
            w, h = im.size
            if min(h, w) > min_side_dim and max(h, w) < max_side_dim:
                r = 0
                cut = toJpeg(im,newfile,max_side_dim,outFolder,r)
Using the exported images, I manually label a set of training images (N=22,435). For ambigous cases, I create a script that asks the Google Maps Static API for a reference photo of the same coordinates:
import pickle
import time
import requests

def second_opinion(id,coords,topath):
    GOOGLE_MAPS_API_URL = 'https://maps.googleapis.com/maps/api/staticmap'

    coords = str(coords[1]) + "," + str(coords[0])

    params = {
            'key': API_KEY,
            'size': '512x512',
            'maptype': 'satellite',
            'zoom': '20',
            'format': 'jpg',
            'center': coords
        }
    response = requests.get(GOOGLE_MAPS_API_URL, params=params)
    print(response.status_code)
    time.sleep(1)

    filepath = topath + '_gmaps.jpg'
    print(filepath)

    with open(filepath, 'wb') as f:
        f.write(response.content)

#pickled dictionary with unique property id and centroid coordinate (WGS84)
ay_dict = pickle.load(open("ay_point_wgs.p", "rb" ))

second_opinion(id_dict, ay_dict.get(id_dict), topath)
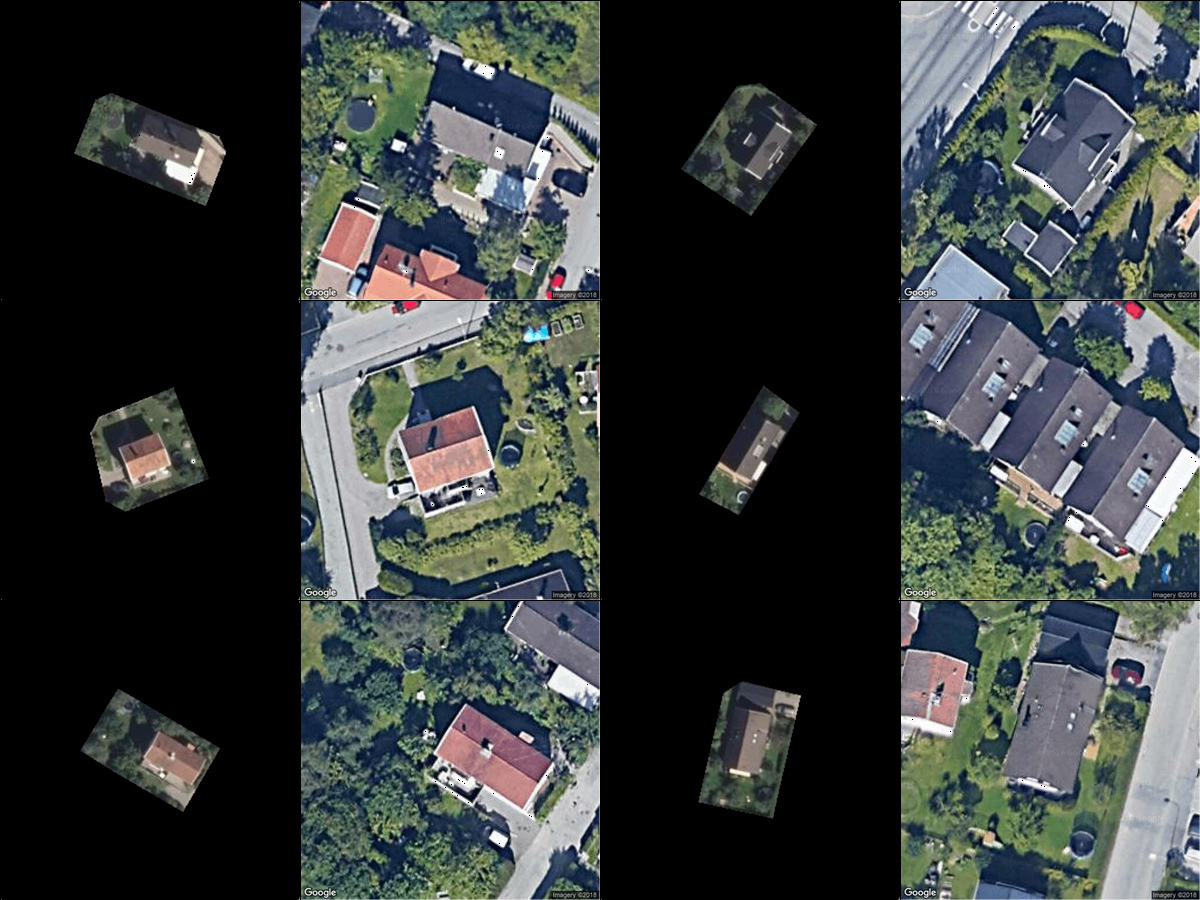
Since the Google Maps image is often of higher resolution than my source images, it can facilitate labeling in ambigous cases as shown here:
For training, I use the Keras implementation of Inception ResNet which I instantiate with pre-trained ImageNet weights and a Tensorflow GPU backend. All training is done on an Nvidia GTX1080Ti.
from keras import Model
from keras.applications.inception_resnet_v2 import InceptionResNetV2
from keras.applications.inception_resnet_v2 import preprocess_input
from keras.preprocessing.image import ImageDataGenerator
from keras.callbacks import Callback
from keras.callbacks import ModelCheckpoint
from keras.layers.core import Dense
from keras.layers import Input
from keras.models import Sequential
from keras.optimizers import Adam

in_shape = (300,300,3)
input = Input(shape=in_shape,name = 'image_input')

#parameters
EPOCHS = 30
BATCH_SIZE = 32
LR = 0.001
DECAY = 0.001
MOMENTUM = 0.9
BETA_1 = 0.9
BETA_2 = 0.999
EPSILON = 1e-08

#model
base_model = InceptionResNetV2(include_top=False, weights='imagenet', input_tensor=None, input_shape=in_shape, pooling='avg')

top_model = Sequential()
top_model.add(Dense(1, input_shape=(base_model.output_shape[1:]), activation='sigmoid'))
model = Model(inputs=base_model.input, outputs= top_model(base_model.output))

adam = Adam(lr=LR, beta_1=BETA_1, beta_2=BETA_2, epsilon=EPSILON, decay=0.0, amsgrad=False)
model.compile(optimizer='adam', loss='binary_crossentropy', metrics = ['accuracy'])

model.summary()
I split my training data 80-10-10. To adress the trampoline/no trampoline imbalance I manually oversample the trampoline class to achieve a 50-50 balance for training and validation. I use the flow_from_directory method and standard augmentation techniques (flip, shift and rotate)
train_datagen = ImageDataGenerator(
    width_shift_range=0.1,
    height_shift_range=0.1,
    vertical_flip=True,
    rotation_range=90,
    horizontal_flip=True,
    samplewise_center=False,
    samplewise_std_normalization=False,
    preprocessing_function=preprocess_input
    )

train_generator = train_datagen.flow_from_directory(
    train_dir,
    target_size=img_size,
    batch_size=BATCH_SIZE,
    shuffle=True,
    class_mode='binary')
I also create callback objects for logging and for gradually reducing the learning rate as the validation accuracy stops improving. The LrReducer class allows the user to set parameters that determine the learning rate reduction and early stopping conditions.
class LrReducer(Callback):
    def __init__(self, patience=1, reduce_rate=0.5, reduce_nb=6, verbose=1):
        super(Callback, self).__init__()
        self.patience = patience
        self.wait = 0
        self.best_score = -1.
        self.reduce_rate = reduce_rate
        self.current_reduce_nb = 0
        self.reduce_nb = reduce_nb
        self.verbose = verbose

    def on_epoch_end(self, epoch, logs={}):
        current_score = logs.get('val_acc')
        if current_score > self.best_score:
            self.best_score = current_score
            self.wait = 0
            if self.verbose > 0:
                print('---current best val accuracy: %.3f' % current_score)
        else:
            if self.wait >= self.patience:
                self.current_reduce_nb += 1
                if self.current_reduce_nb <= self.reduce_nb:
                    lr = K.get_value(self.model.optimizer.lr)
                    #lr = self.model.optimizer.lr.get_value()
                    K.set_value(self.model.optimizer.lr,lr*self.reduce_rate)
                    new_lr = K.get_value(self.model.optimizer.lr)
                    #self.model.optimizer.lr.set_value(lr*self.reduce_rate)
                    if self.verbose > 0:
                        print('---LR reduced to: %f' % new_lr)
                else:
                    if self.verbose > 0:
                        print("Epoch %d: early stopping" % (epoch))
                    self.model.stop_training = True
            self.wait += 1

logCallback = EndCallback(timestr)
lrReduce = LrReducer()

filepath = model_path+"/ResNet-{epoch:02d}-{val_acc:.3f}.h5"  # unique file name that will include the epoch and the validation acc for that epoch
Checkpoint = ModelCheckpoint(filepath, monitor='val_acc', verbose=1, save_best_only=True, mode='max') # saves only the best ones

model.fit_generator(
    train_generator,
    steps_per_epoch=int(train_size/BATCH_SIZE),
    epochs=EPOCHS,
    validation_data=validation_generator,
    validation_steps=int(val_size/BATCH_SIZE), callbacks=[logCallback, lrReduce, Checkpoint])

model.save_weights("models/{}_weights.h5".format(NAME))
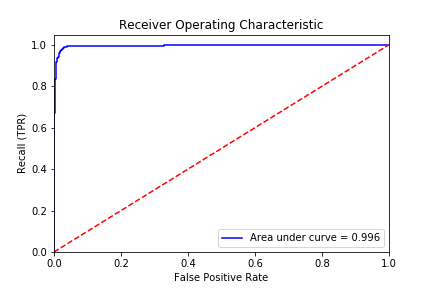
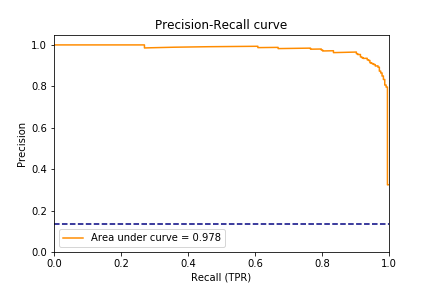
model.save("models/{}.h5".format(NAME))In validation.py, I evaluate final model performance on the test set of manually labeled images (N = 1,819):
To visualize the prediction, I can overlay the predicted class for each property on the original photo (red = 'No trampoline', blue = 'Trampoline')


