- Introduction
- Architecture
- BookInfo Sample Application
- Prerequisites
- Deployment
- Validation
- Tear Down
- Troubleshooting
- Relevant Material
Istio is part of a new category of products known as "service mesh" software designed to manage the complexity of service resilience in a microservice infrastructure; it defines itself as a service management framework built to keep business logic separate from the logic to keep your services up and running. In other words, it provides a layer on top of the network that will automatically route traffic to the appropriate services, handle circuit breaker logic, enforce access and load balancing policies, and generate telemetry data to gain insight into the network and allow for quick diagnosis of issues.
For more information on Istio, please refer to the Istio documentation. Some familiarity with Istio is assumed.
This repository contains demonstration code to create an Istio service mesh in a single GKE cluster and use Prometheus, Jaeger, and Grafana to collect metrics and tracing data and then visualize that data.
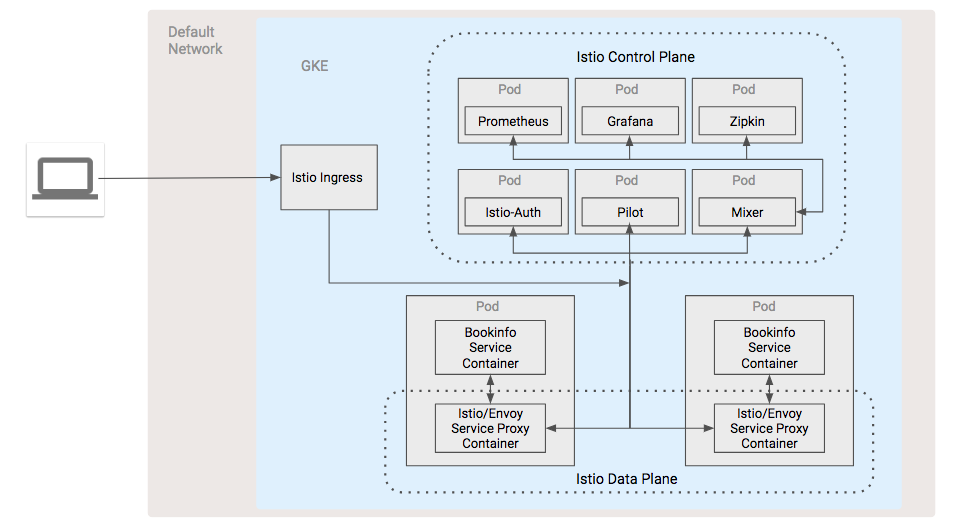
Istio has two main pieces that create the service mesh: the control plane and the data plane.
The control plane is made up of the following set of components that act together to serve as the hub for the infrastructure's service management.
-
Mixer: a platform-independent component responsible for enforcing access control and usage policies across the service mesh and collecting telemetry data from the Envoy proxy and other services
-
Pilot: provides service discovery for the Envoy sidecars, traffic management capabilities for intelligent routing, (A/B tests, canary deployments, etc.), and resiliency (timeouts, retries, circuit breakers, etc.)
-
Citadel: provides strong service-to-service and end-user authentication using mutual TLS, with built-in identity and credential management.
The data plane is comprised of all the individual service proxies that are distributed throughout the infrastructure. Istio uses Envoy with some Istio-specific extensions as its service proxy. It mediates all inbound and outbound traffic for all services in the service mesh. Istio leverages Envoy’s many built-in features such as dynamic service discovery, load balancing, TLS termination, HTTP/2 & gRPC proxying, circuit breakers, health checks, staged roll-outs with percentage-based traffic splits, fault injection, and rich metrics.
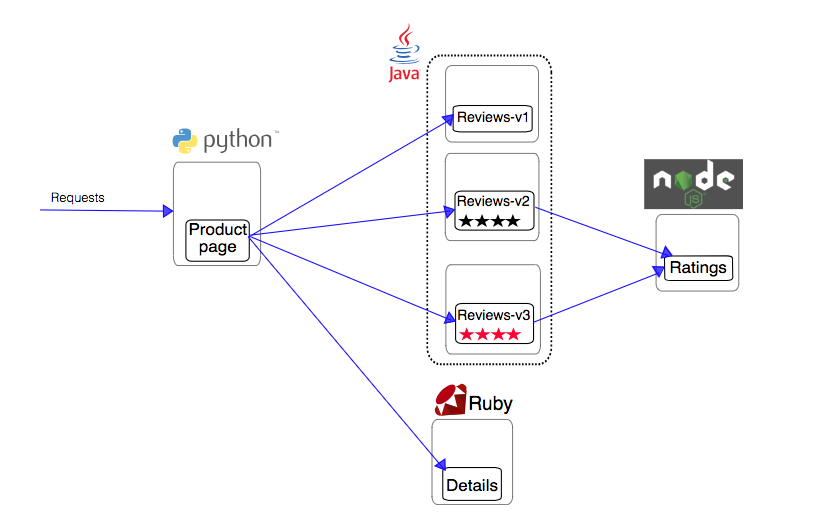
The sample BookInfo application displays information about a book, similar to a single catalog entry of an online book store. Displayed on the page is a description of the book, book details (ISBN, number of pages, and so on), and a few book reviews.
The BookInfo application is broken into four separate microservices and calls on various language environments for its implementation:
- productpage. The productpage microservice calls the details and reviews microservices to populate the page.
- details. The details microservice contains book information.
- reviews. The reviews microservice contains book reviews. It also calls the ratings microservice.
- ratings. The ratings microservice contains book ranking information that accompanies a book review.
There are 3 versions of the reviews microservice:
- Version v1 doesn’t call the ratings service.
- Version v2 calls the ratings service, and displays each rating as 1 to 5 black stars.
- Version v3 calls the ratings service, and displays each rating as 1 to 5 red stars.
To learn more about Istio, please refer to the project's documentation.
The pods and services that make up the Istio control plane is the first part of the architecture that gets installed into Kubernetes Engine, at the time we install the BookInfo application we simultaneously install an istio service proxy alongside each micro service in the application. Our telemetry add-ons are then added to the Control Plane. At this point we have our two tiers that make up the Istio architecture, our Control Plane and our Data Plane, and we have microservices to manage.
In the diagram, note
- all input and output from any BookInfo microservice goes through the service proxy
- each service proxy communicates with each other and the Control plane to implement the features of the service mesh, circuit breaking, discovery, etc.
- the Mixer component of the Control Plane is the conduit for the telemetry add-ons to get metrics from the service mesh
- the Istio ingress component to provide external access to the mesh
- the environment is setup in the Kubernetes Engine default network
In order to use the code in this demo you will need to have have access to a bash shell with the following tools installed:
- Two GCP projects with billing enabled
- Google Cloud SDK (v204.0.0 or later)\
- kubectl (v1.10.0 or later)
- git
To deploy this demo, clone the repository and the shared repository. The shared repository is located here: https://github.com/GoogleCloudPlatform/gke-istio-shared
Once you have both projects cd into this projects directory. Note that this directory is considered the working directory and all of the following commands should be run in it.
- Copy the
propertiesfile toproperties.envand set the following variables in theproperties.envfile: * PROJECT - the name of the project you want to use * REGION - the region in which to locate for all the infrastructure * ZONE - the zone in which to locate all the infrastructure - Run the following command
./execute.shThe script should deploy all of the necessary infrastructure and install Istio.
- On the command line, run the following command:
echo "http://$(kubectl get -n istio-system service istio-ingressgateway -o jsonpath='{.status.loadBalancer.ingress[0].ip}'):$(kubectl get -n istio-system service istio-ingressgateway -o jsonpath='{.spec.ports[?(@.name=="http")].port}')/productpage"- Visit the generated URL in your browser to see the BookInfo application.
- Run the following command on the command line
kubectl -n istio-system port-forward $(kubectl -n istio-system get pod -l app=prometheus -o jsonpath='{.items[0].metadata.name}') 9090:9090 &- Visit the following URL in your web browser: http://localhost:9090/graph
For more information on how to use Prometheus with Istio, please refer to the Istio documentation
- Run the following command:
kubectl -n istio-system port-forward $(kubectl -n istio-system get pod -l app=grafana -o jsonpath='{.items[0].metadata.name}') 3000:3000 &- Visit the following url in your web browser: http://localhost:3000/dashboard/db/istio-dashboard
For more information on how to use Grafana with Istio, please refer to the Istio documentation
- Run the following command:
kubectl port-forward -n istio-system $(kubectl get pod -n istio-system -l app=jaeger -o jsonpath='{.items[0].metadata.name}') 16686:16686 &- Visit the following url in your web browser: http://localhost:16686
For more information on how to generate sample traces, please refer to the Istio documentation.
To tear down the resources created by this demonstration, run
./remove.shThis demo was created with help from the following links:
- https://cloud.google.com/kubernetes-engine/docs/tutorials/istio-on-gke
- https://cloud.google.com/compute/docs/tutorials/istio-on-compute-engine
- https://istio.io/docs/guides/bookinfo.html
- https://istio.io/docs/tasks/telemetry/querying-metrics/
- https://istio.io/docs/tasks/telemetry/using-istio-dashboard/
- https://istio.io/docs/tasks/telemetry/distributed-tracing/
This is not an officially supported Google product

