- Introduction
- Architecture
- Prerequisites
- Deployment
- Validation
- Teardown
- Troubleshooting
- Relevant Material
Stackdriver Monitoring is used to visualize the performance, uptime, and overall health of your applications. The Stackdriver Monitoring console allows you to visualize data across all projects in GCP in a single interface.
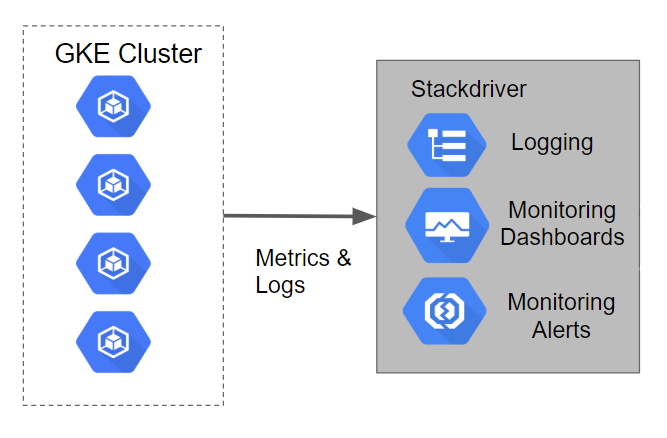
This tutorial will walk you through setting up Monitoring and visualizing metrics from a Kubernetes Engine cluster. It makes use of Terraform, a declarative Infrastructure as Code tool that enables configuration files to be used to automate the deployment and evolution of infrastructure in the cloud. The logs from the Kubernetes Engine cluster will be leveraged to walk through the monitoring capabilities of Stackdriver.
Note: The setup of Stackdriver Monitoring is not automated with a script because it is currently not supported through Terraform or via the gcloud command line tool.
The tutorial will create a Kubernetes Engine cluster that has a sample application deployed to it. The logging and metrics for the cluster are loaded into Stackdriver Logging by default. In the turorial a Stackdriver Monitoring account will be setup to view the metrics captured.
The steps described in this document require the installation of several tools and the proper configuration of authentication to allow them to access your GCP resources.
You'll need access to a Google Cloud Project with billing enabled. See Creating and Managing Projects (https://cloud.google.com/resource-manager/docs/creating-managing-projects) for creating a new project. To make cleanup easier it's recommended to create a new project.
The following APIs need to be enabled:
- Cloud Resource Manager API
- Kubernetes Engine API
- Stackdriver Logging API
- Stackdriver Monitoring API
A script is provided in the /scripts folder named enable-apis.sh that will enable these three API's. Follow these steps to execute the script:
- In the GCP console, change to the project you want to enable the API's for.
- Click on the Activate Cloud Shell Console Visit the APIs & Services section of the GCP Console.
- Upload the enable-apis.sh script in the Cloud Shell window.
- Execute the script.
The Google Cloud SDK is used to interact with your GCP resources. Installation instructions for multiple platforms are available online.
Terraform is used to automate the manipulation of cloud infrastructure. Its installation instructions are also available online.
The Terraform configuration will execute against your GCP environment and create a Kubernetes Engine cluster running a simple application. The configuration will use your personal account to build out these resources. To setup the default account the configuration will use, run the following command to select the appropriate account:
gcloud auth application-default login
Following the principles of Infrastructure as Code and Immutable Infrastructure, Terraform supports the writing of declarative descriptions of the desired state of infrastructure. When the descriptor is applied, Terraform uses GCP APIs to provision and update resources to match. Terraform compares the desired state with the current state so incremental changes can be made without deleting everyingt and starting over. For instance, Terraform can build out GCP projects and compute instances, etc., even set up a Kubernetes Engine cluster and deploy applications to it. When requirements change, the descriptor can be updated and Terraform will adjust the cloud infrastructure accordingly.
This example will start up a Kubernetes Engine cluster and deploy a simple sample application to it. By default, Kubernetes Engine clusters in GCP are provisioned with a pre-configured Fluentd-based collector that forwards logs to Stackdriver.
The terraform configuration takes two parameters to determine where the Kubernetes Engine cluster should be created:
- project
- zone
For simplicity, these parameters should be specified in a file named terraform.tfvars, in the terraform directory. To generate this file based on your glcoud defaults, run:
./generate-tfvars.sh This will generate a terraform/terraform.tfvars file with the following keys. The values themselves will match the output of gcloud config list:
# Contents of terraform.tfvars
project="YOUR_PROJECT"
zone="YOUR_ZONE"
If you need to override any of the defaults, simply replace the desired value(s) to the right of the equals sign(s). Be sure your replacement values are still double-quoted.
There are three Terraform files provided with this example. The first one, main.tf, is the starting point for Terraform. It describes the features that will be used, the resources that will be manipulated, and the outputs that will result. The second file is provider.tf, which indicates which cloud provider and version will be the target of the Terraform commands--in this case GCP. The final file is variables.tf, which contains a list of variables that are used as inputs into Terraform. Any variables referenced in the main.tf that do not have defaults configured in variables.tf will result in prompts to the user at runtime.
Given that authentication was configured above, we are now ready to run Terraform. In order to establish the beginning state of your cloud infrastructure you must first initialize Terraform:
$ terraform init
This will create a hidden directory called .terraform in your current working directory and populate it with files used by Terraform.
It is a good practice to do a dry run of Terraform prior to running it:
$ terraform plan
Plan will prompt for any variables that do not have defaults and will output all the changes that Terraform will perform when applied. If everything looks good then it is time to put Terraform to work assembling your cloud infrastructure:
$ terraform apply
You will need to enter any variables again that don't have defaults provided. If no errors are displayed then after a few minutes you should see your Kubernetes Engine cluster in the GCP Console with the sample application deployed.
In this section we will create a Stackdriver Monitoring account so that we can explore the capabilities of the Monitoring console.
The following steps are used to setup a Stackdriver Monitoring account.
- Visit the Monitoring section of the GCP Console. This will launch the process of creating a new Monitoring console if you have not created one before.
- On the Create your free StackDriver account page select the project you created earlier. Note: You cannot change this setting once it is created.
- Click on the Create Account button.
- On the next page, Add Google Cloud Platform projects to monitor you can leave this alone since the project is already selected it isn't necessary to select any other projects. Note: You can add and remove projects at a later date if necessary.
- Click the Continue button.
- On the Monitor AWS accounts page you can choose to specify your AWS account information or skip this step.
- For this tutorials purposes you can click the Skip AWS Setup button.
- On the Install the Stackdriver Agents page you are provided with a script that can be used to add the Stackdriver Monitoring and Logging agents on each of your VM instances. Note: The tracking of VM's is not automatic like it is for Kubernetes Engine. For the purposes of this tutorial this script is not needed.
- Click the Continue button.
- On the Get Reports by Email page you can simply select any of the options depending on whether you want to receive the reports. For the purposes of this demo we will not be using the reports.
- Click the Continue button.
- The actual creation of the account and underlying resources takes a few minutes. Once completed you can press the Launch monitoring button.
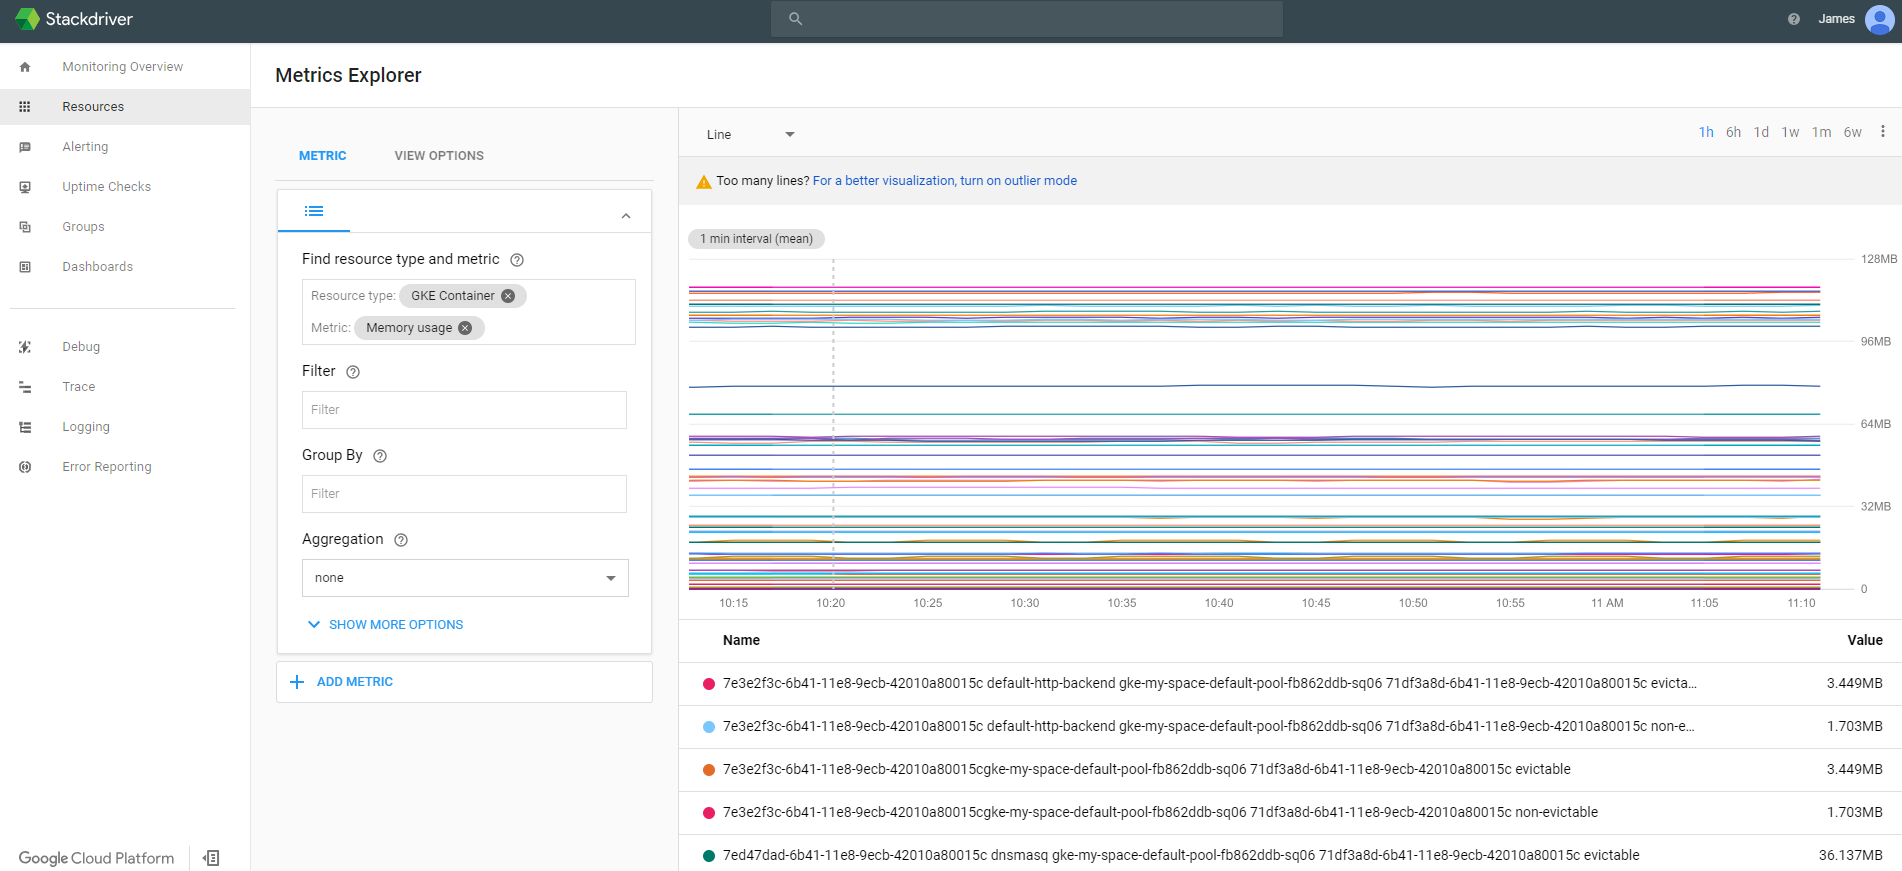
Metrics Explorer is a simple way for viewing metrics quickly. The following steps are detail out how to use the Metrics Explorer:
- Click on the menu Resources -> Metrics Explorer to bring up the Metrics Explorer screen.
- In the Find resource type and metric option type GKE Container.
- This will give you a listing of all metrics related to GKE Container. Select the Memory usage metric.
- This will graph the GKE Container -> Memory usage on the right hand of the page. The screen should look similar to the following, but likely won't show as much timeseries history if the cluster and Stackdriver account was recently created:
You can further update the screen by adding additional metrics, or further customizing the metric you already added (by including specific filtering, grouping, aggregation, etc.).
The Alerting capability in Stackdriver Monitoring allows you to define alert policies which contain conditions such as looking for a metric exceeding a threshold that trigger notifications to a channel such as email, sms message and hipchat. Alerts that trigger will create an incident which are recorded and tracked for historical reporting. Once the conditions of the alert are no longer satisfied, the incident is automatically closed.
The following steps describe how to create the an alert for a threshold condition.
- In the console click on the Alerting -> Create a policy option.
- Click on the Add condition button.
- The Selection condition type page is displayed. This page allows you to select various condition types that you want to measure.
- Click on the Select button in the Metric Threshold section.
- On the Add Metric Threshold Condition page we can specify the specific metric we want to monitor. On this page enter the following criteria:
- Resource Type - GKE Container
- Applies To - Group
- If Metric - CPU Utilization
- Condition - above
- Threshold - 70%
- For - 1 Minute
- Click on the Save button.
- In the Notifications section leave the type as Email, and enter in an email account that you can access.
- In the Documentation section enter a custom message.
- In the Name this policy section enter a name for the alert (i.e. GKE CPU Utilization Alert).
- Click on the Save Policy button.
Stackdriver Uptime Checks can be configured to verify that your services or applications are up and accessible. The checks can be performed from various locations around the world, and the results can be used to enable alerting policies, as well as direct monitoring from the uptime-check dashboard. This section will discuss the process for creating an uptime-check for the application hosted inside the Kubernetes Engine container. Note: With each Stackdriver account you can have up to 100 uptime-checks.
The following steps should be followed to create an uptime-check.
To begin with we need to have an application or URL to monitor. The Kubernetes Engine container contains a simple application that can be used for this. Follow the steps to get the IP address to use to setup this test.
- In the GCP console navigate to the Networking -> Network services page.
- On the default Load balancing page that shows up, click on the TCP load balancer that was setup.
- On the Load balancer details page there is a top section labeled Frontend. Note the IP:Port value as this will be used in the upcoming steps.
Using the IP:Port value you can now access the application. Go to a browser and enter the URL. The browser should return a screen that looks similar to the following:
The following steps describe how to create the uptime-check.
- Navigate to the Stackdriver Monitoring console in your browser.
- In the console click on the Uptime Checks -> Uptime Check Overview option.
- This brings you to the main Uptime Checks page. Click on the Create an Uptime Check button.
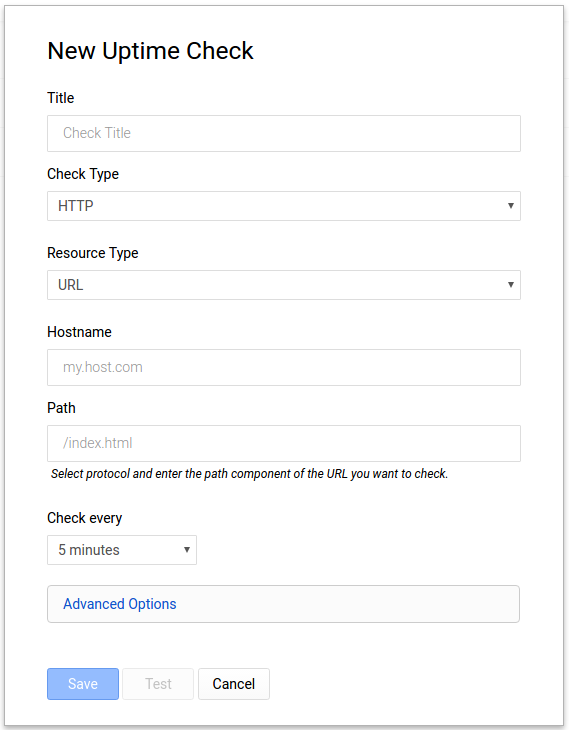
- This will bring up the New Uptime Check page. The screen will look like the following:
On this page enter the following parameters:
- Title - Uptime Test Check
- Check Type - HTTP (Should be the default)
- Resource Type - URL (Should be the default)
- Hostname - Enter just the IP address that was obtained above
- Path - Leave this blank
- Check every - 1 minute
- Click on Advanced Options
- Port - 8080
- Click on the Test button to verify that all the information you entered was correct. If it doesn't give you a 200 return code go back and check the values entered above.
- Click on the Save button to save your entry.
- From the Uptime Checks page you can review and monitor the results of your check.
When you are finished with this example, and you are ready toclean up the resources that were created so that you avoid accruing charges, you can run the following Terraform command to remove all resources :
$ terraform destroy
Terraform tracks the resources it creates so it is able to tear them all back down.
** The install script fails with a Permission denied when running Terraform.**
The credentials that Terraform is using do not provide the
necessary permissions to create resources in the selected projects. Ensure
that the account listed in gcloud config list has necessary permissions to
create resources. If it does, regenerate the application default credentials
using gcloud auth application-default login.
** Metrics Not Appearing or Uptime Checks not executing ** After the scripts execute it may take a few minutes for the Metrics or Uptime Checks to appear. Configure the items and give the system some time to generate metrics and checks as they someimes take time to complete.
- Kubernetes Engine Monitoring
- Stackdriver Kubernetes Monitoring
- Managing Uptime Checks
- Terraform Google Cloud Provider
This is not an officially supported Google product


