Unveil the Top Fastest Growing Private Companies in America for the Last Thirteen Years (2007 - 2020)
This project is designed to conduct a presentation of business information or Business Intelligence by extracting, transforming, and loading the top fastest-growing private companies in America for the last thirteen years (2007-2020).
The purpose of this project was to build a database that demonstrates the changes in American top fastest-growing private companies through time. The database is built on by ingesting, combining, and restructuring data from three main data sources into a conformed one Postgresql database, and deploy in to Flask app. The three sources of our data are Inc 5000, Financial times ranking 500 2020, and Growjo Company API for scraping fastest-growing companies in 2020.
In this project we extracted, transformed, and loaded thirteen years (2007-2020) American top fastest-growing private companies.
Our main sources:
-
Inc 5000 from year 2007 till 2019 - Data sourced from Data World Inc
-
Financial times ranking 500 2020 - Data sourced through web scraping
-
We make an API call on the Growjo website and generated the company's information based on domains. For this reason, we prepared a python file called company_domain.py that lists American top fastest-growing private companies domain, and we requested information for each domain and stored information in a data frame. For example, you could retrieve a company’s name, location, employee, estimated revenue, and job openings from their domain name.
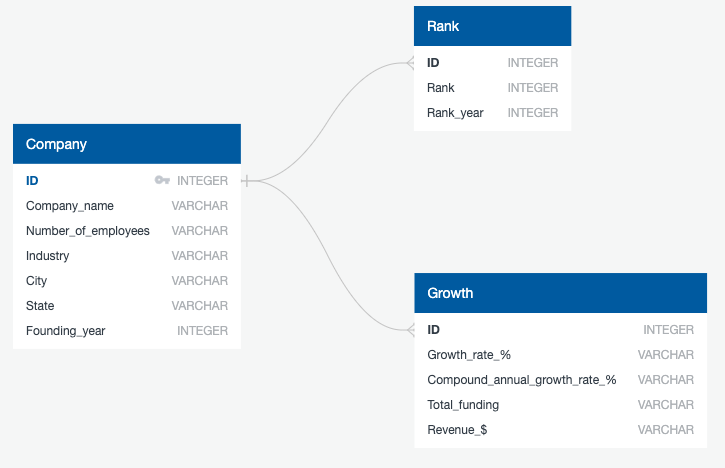
After extracting the data we conducted a data engineering, and Entity-Relationship Diagram (ERD) by using an open-source toolkit called Quickdatabasediagrams.
The model looks as follows:

- We used a Pandas functions in Jupyter Notebook to transform all CSV files, scraped data, and API request responses.
- We reviewed the files and transformed into a dataframes.
- We used a python transformation functions for data cleaning, joining, filtering, and aggregating.
- Several columns removed
- Duplicate rows was removed, and successfully managed.
- We conducted some aggregation to find totals for comparison in the datasets.
- For our final production, we used a relational database called Postgresql, in a total of three tables, twelve columns created, and the data loaded successfully. A flask app is also created for any one to get access the data.
- Final tables/collections are stored in the production database
| id | company_name | number_of_employees | industry | city | state | country | |
|---|---|---|---|---|---|---|---|
| 0 | 20391 | SwanLeap | 49.0 | Logistics & Transportation | Madison | WI | United States |
| 1 | 16357 | PopSockets | 118.0 | Consumer Products & Services | Boulder | CO | United States |
| 2 | 9922 | Home Chef | 865.0 | Food & Beverage | Chicago | IL | United States |
| 3 | 22829 | Velocity Global | 55.0 | Business Products & Services | Denver | CO | United States |
| 4 | 5896 | DEPCOM Power | 104.0 | Energy | Scottsdale | AZ | United States |
| id | rank | rank_year | |
|---|---|---|---|
| 0 | 20391 | 1 | 2018 |
| 1 | 16357 | 2 | 2018 |
| 2 | 9922 | 3 | 2018 |
| 3 | 22829 | 4 | 2018 |
| 4 | 5896 | 5 | 2018 |
| Total Companies | |
|---|---|
| 0 | 24115 |
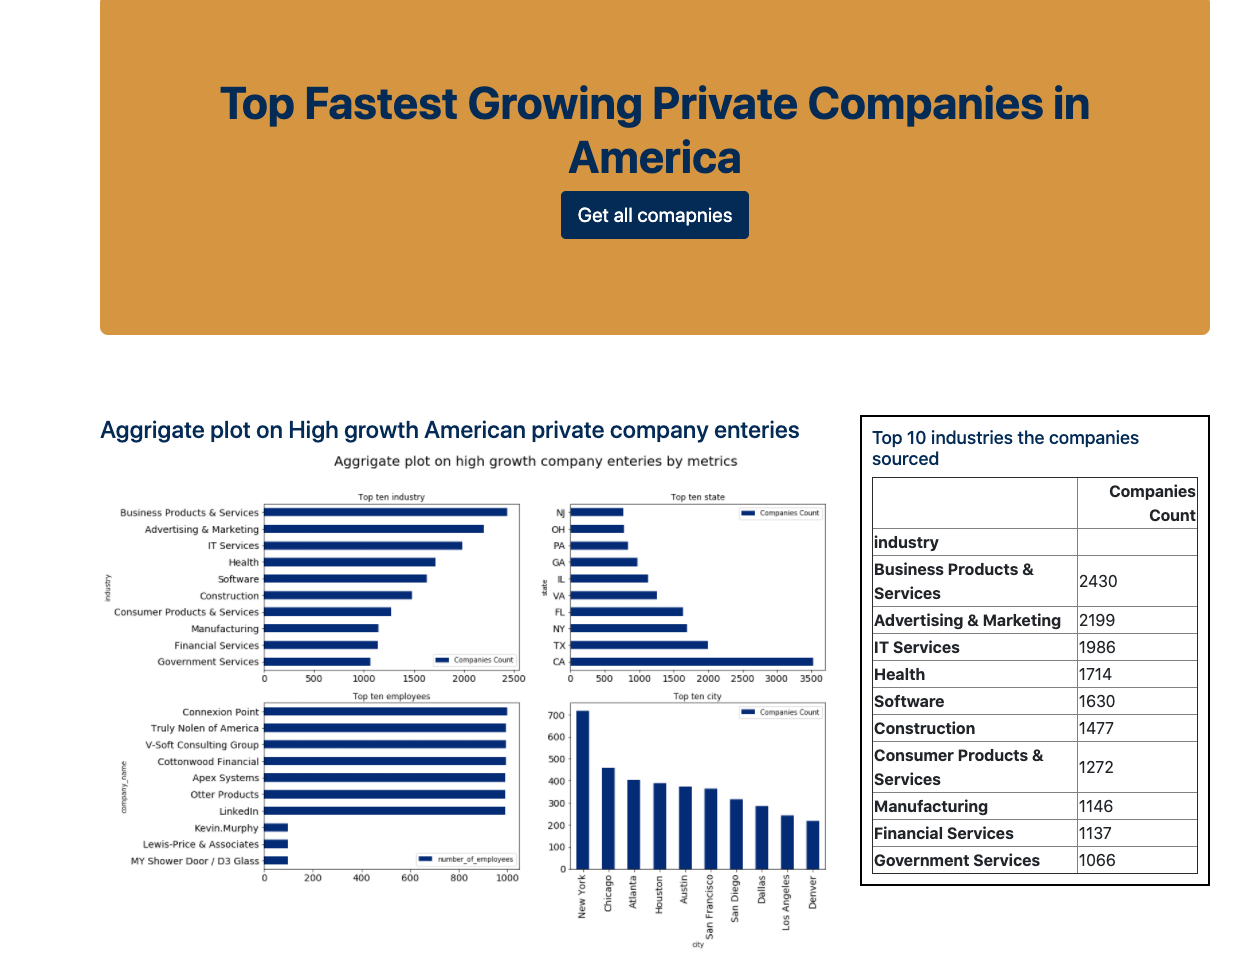
We used Postgresql with Flask templating to create a new HTML page that displays information about our project work.
- We created a root route
/which serve as a home page - We created a route called
/companiesthat will displaye the json file for companies list.
Finally, we created a template HTML file called index.html that take companies information, and displayed them.
- Adedamola Atekoja (‘Damola)
- Amanda Qianyue Ma
- Amos Johnson
- Ermias Gaga
- Maria Lorena


