Yelp is a user-driven small business directory which allows users from anywhere in the world to rate, review, as well as the online reservation service. Due to the vast number of restaurants spread worldwide, it is very difficult to get to know the quality of a restaurant and the services they provide. Yelp provides us with reviews and ratings provided by the users and other services offered by the restaurants. In-order-to invest in a business or start a new one, one should have an idea of the reasons behind the success of the restaurant. The original yelp data set has the general details of restaurants but there is no analytics to infer customer satisfaction and the reasons behind the success of a restaurant. If the factors contributing to the success of a restaurant are known, it would be easy for future investors to make wise financial decisions easily. On this project we focus on investigating the relationship between rating, and review counts of customers to expain the restaurants yelp status.
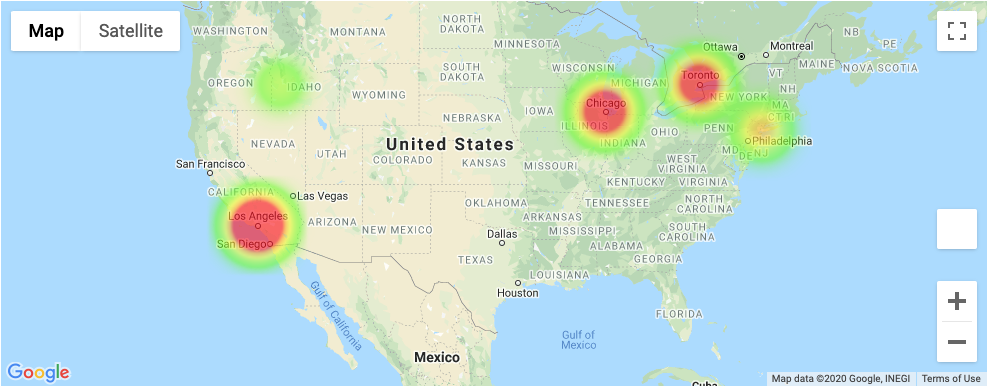
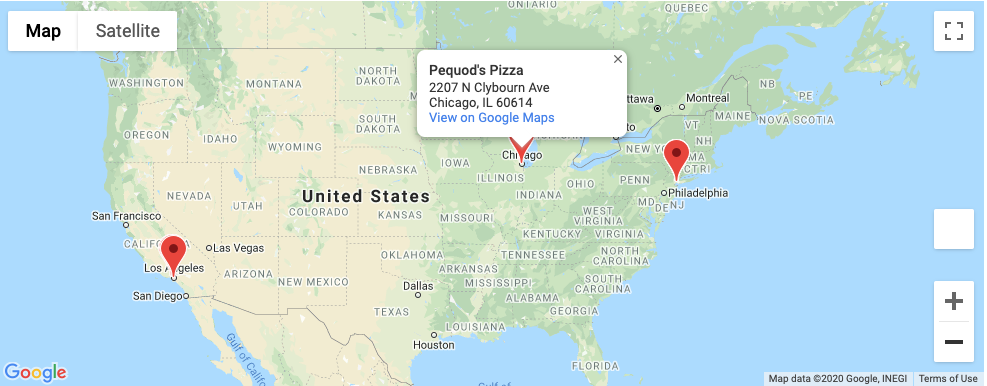
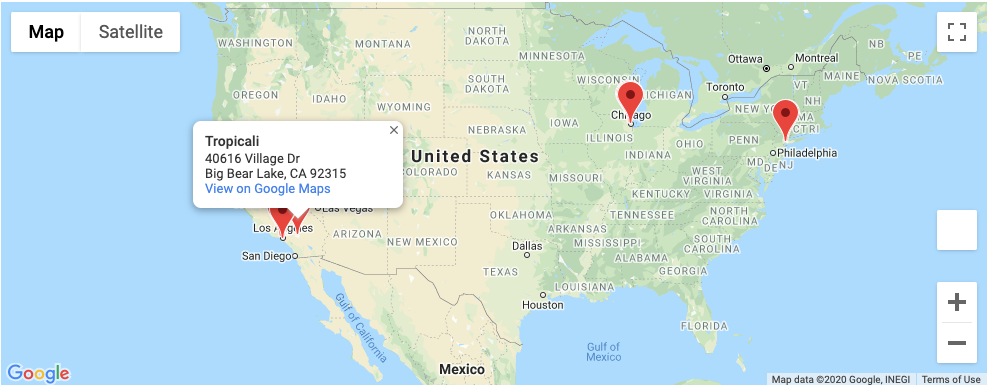
This respository performed analysis on Yelp's dataset, and share observable trends and insights. The dataset used a subset of Yelp's restaurants businesses, their rating, review count, and other informations. In the dataset you'll find information about restaurants across 4 main cities (New-York, Los Angeles, Chicago, and Toronto), and 185 cities in metropolitan areas in United States and Canada. A Google Map Api is also used to heat map all resturants in the dataset, and mark the top rated, and reviewed restaurants.
The project is conducted in Jupyter notebook, a link is created on Jupyter Notebook Viewer, and a google slide pesentaion to showcase, and communicate the analysis report. Look at the following links to see the project results:
- Main Objectives or Questions
- Data Sources
- Data Cleaning
- Data Analysis
- Observable Trends and Insights
This project tried to answer the following main questions:
- Is there a relationship or correlation between rating and number of reviews?
- Is pricing related to the restaurant rating? (eg. the higher the price range, the more likely it will have a higher rating)
- Does the location of a restaurant affect its rating?
- What are the average, above-average and below-average restaurants?
This project used Yelp, and Google Map Api to generate, and work on restaurant dataset among the top four largest cities in North America (New-York, Los Angeles, Chicago, and Toronto), and their surrounding areas. The data is generated by using Yelp API calls and transformed to csv file so that we can apply Python to analyze, and visualize the dataset. To see the process how to use yelp API, and request the dataset please visit the following subfolder link Yelp-Api
- Information on 19995 restaurants
- The data spans 4 main cities (New-York, Los Angeles, Chicago, and Toronto) and 185 cities in metropolitan areas in united states and Canada.
- Google map visualization
The data cleaning process includes renaming the column heading, remove the duplicate rows, and drop irrelevant data columns. The data points before cleaning were 19995, and after cleaning, 15731 data points get ready for analysis.
The data analysis has two part the first part is making summery analysis on the metrics of the dataset, and the second part is the main analysis which includes Correlation and Regression.
| Total Restaurant Number | Total Number of Cities | Avarage Rating | The Average Review Count | % Restaurants Top Rating | % Restaurants Bottom Rating | % Restaurants Top Review Count | % Restaurants Bottom Review Count | % Best Restaurants | % Worst restaurants | |
|---|---|---|---|---|---|---|---|---|---|---|
| 0 | 15731 | 189 | 3.61 | 260.26 | 51.88% | 6.93% | 25.97% | 52.37% | 4.84% | 2.42% |
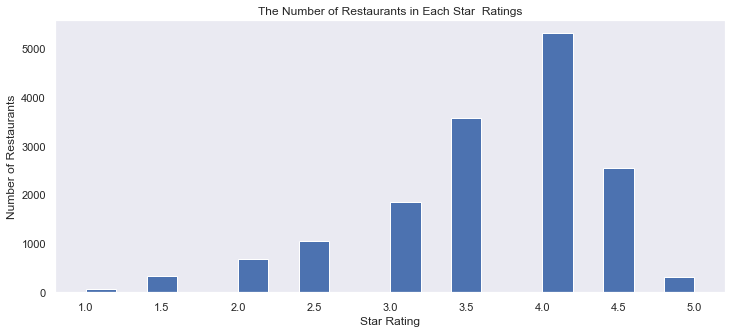
The most common restaurant review rating given at most places is 4 stars out of 5. The Average rating is 3.61.
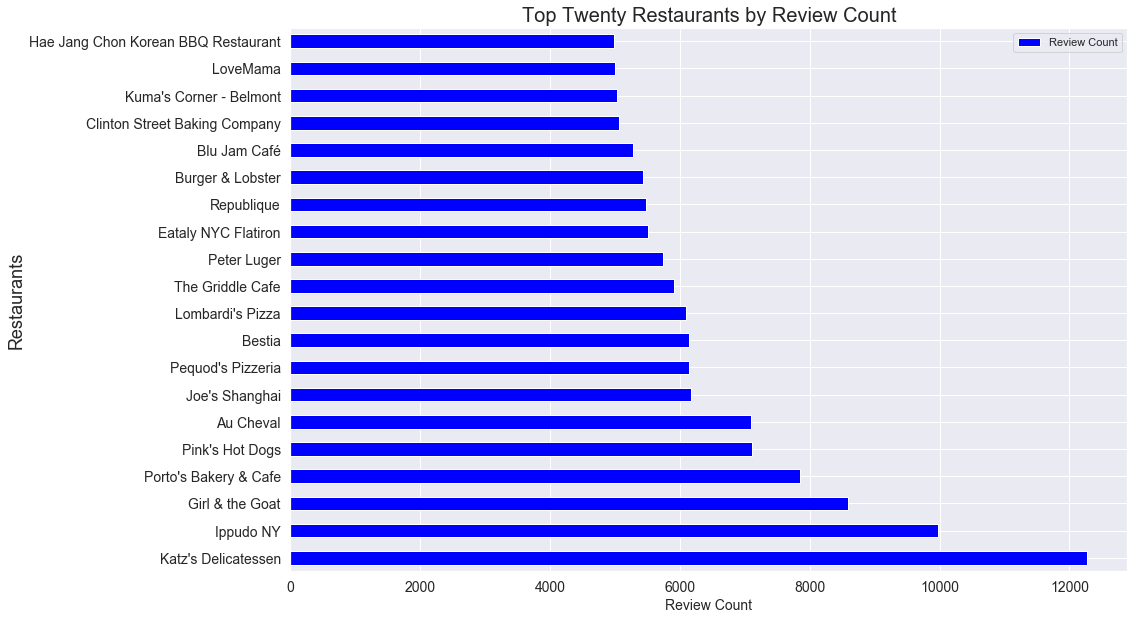
The top review count result, Katz’s Delicatessen has a 4.5 star rating with 21,803 reviews. Meanwhile the lowest of the top 20, Hae Jang Chon Korean BBQ Restaurant also has a 4.5 star rating with 2,427 reviews.
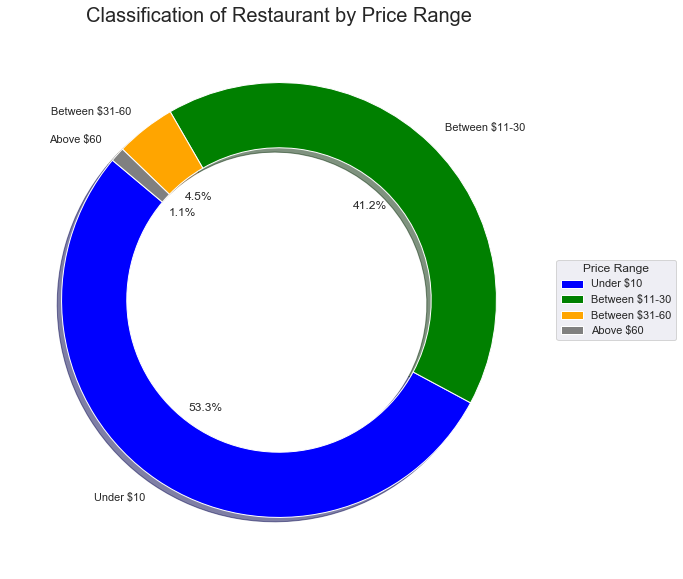
Price Range ($)
- $ = Under $10
- $$ = Between $11-$30
- $$$ = Between $31-$60
- $$$$ = Above $60
The top restaurants from our data appear mostly in Los Angeles, Chicago, Toronto and New York.The three states are California, Illinois and New York. The only province is Ontario.
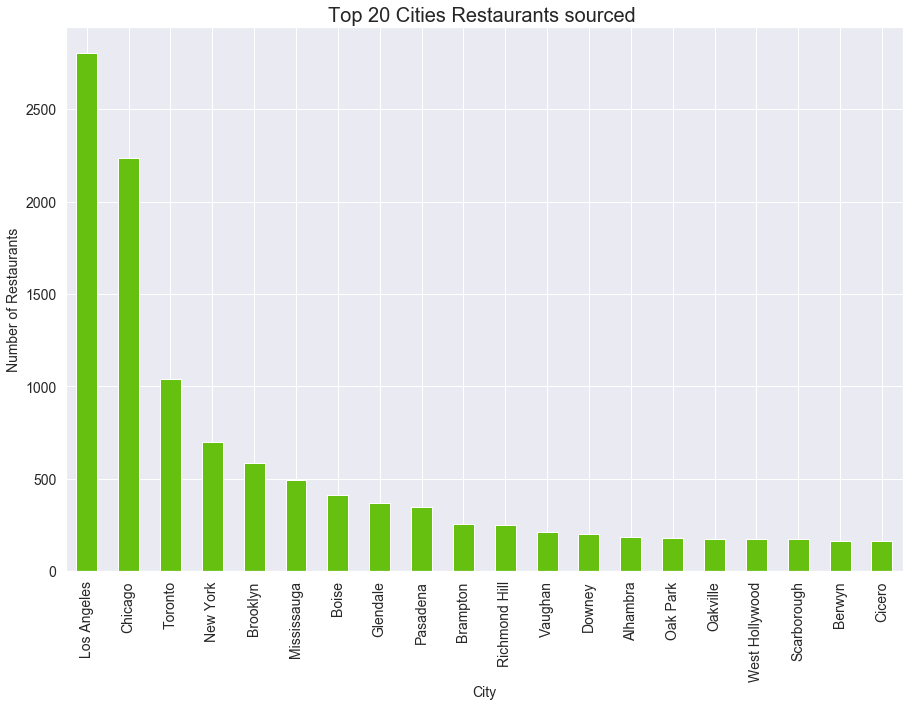
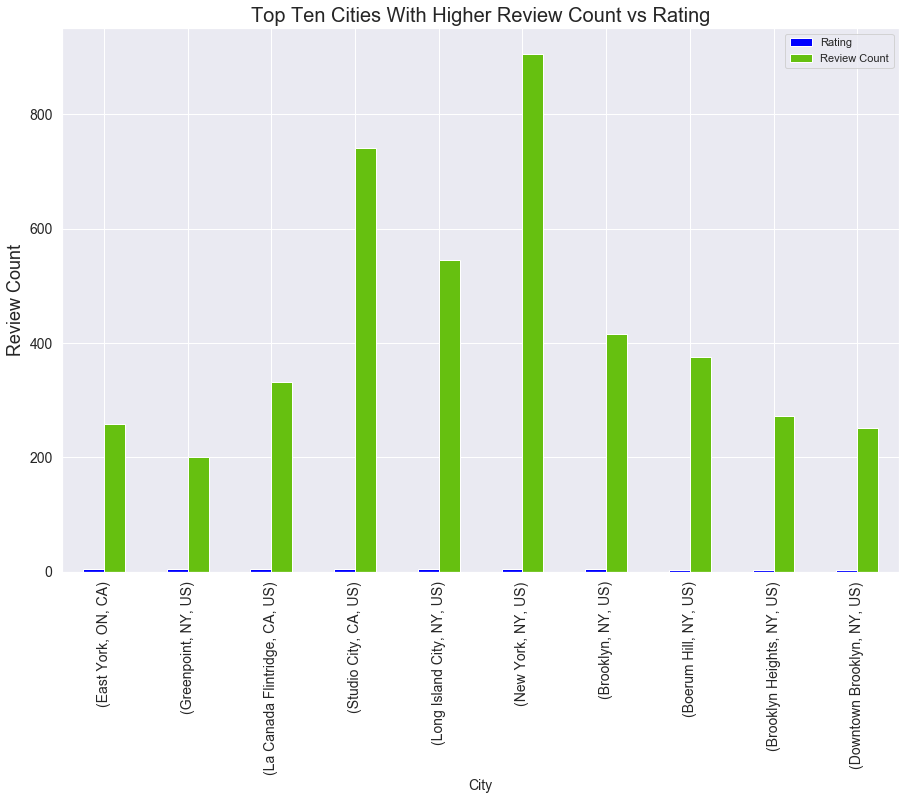
The top cities with highest average rating and review count.
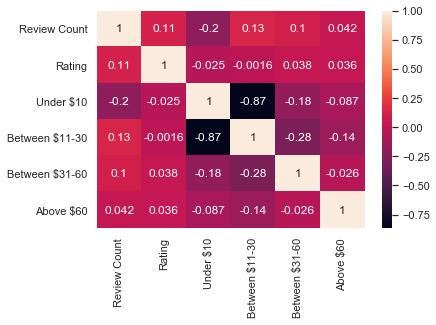
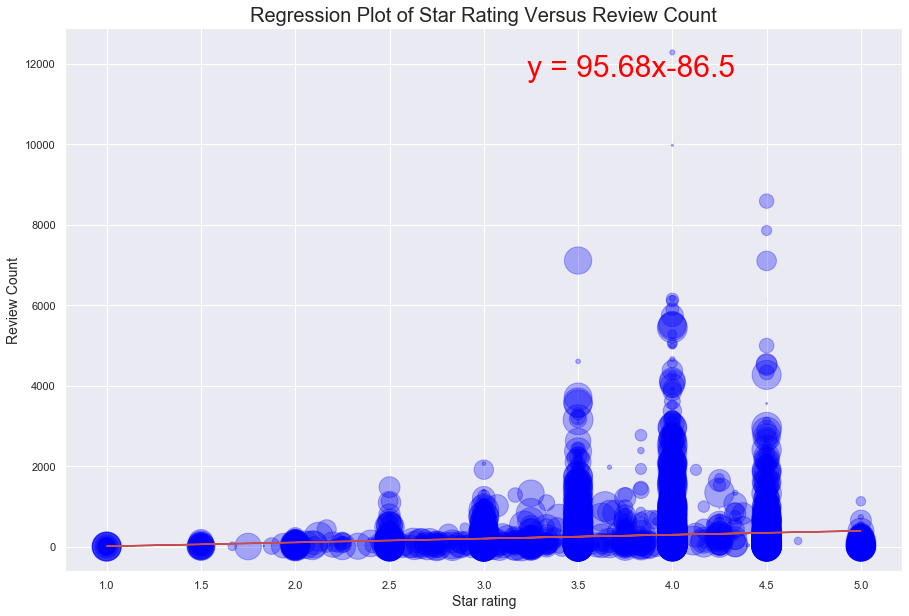
The result on the restaurant's star rating versus review count showed a very weak positive correlation (0.11), and very low R-squared value(0.012).Therefore it’s indicated that while both variables go up in response to one another, the relationship is not very strong, and the regression model does not fit significantly to predict the data.
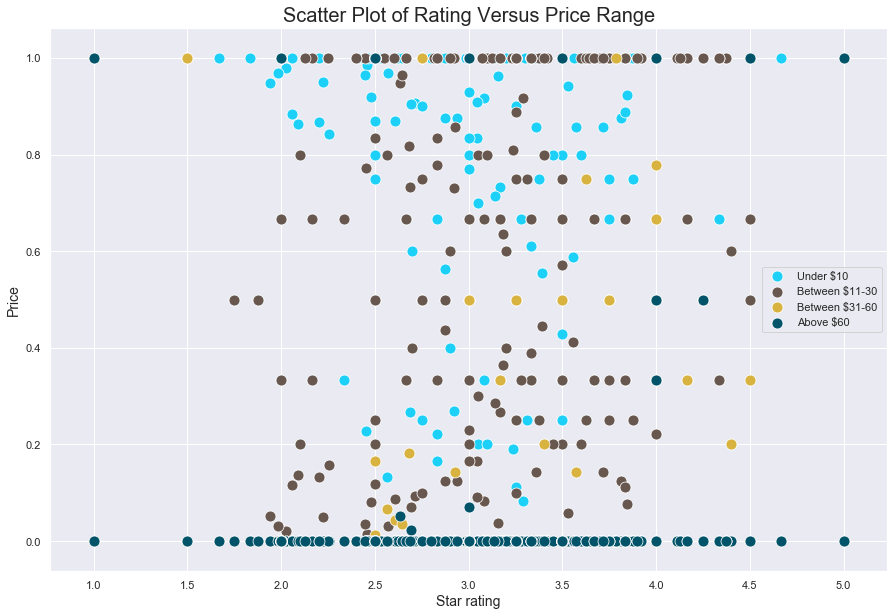
A scatter plot that displays the relationship between star rating versus price, the color differentiation shows the difference in price range.
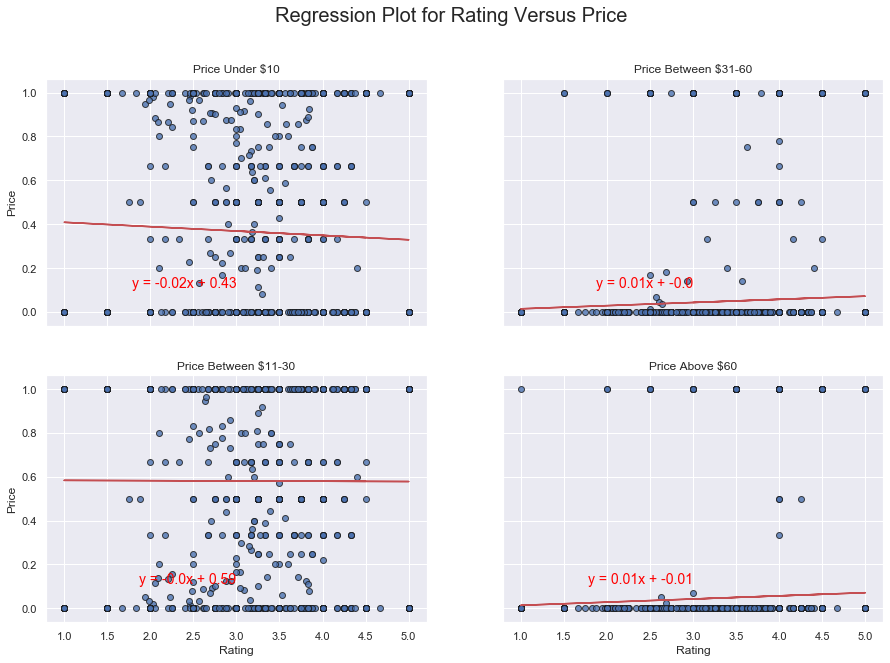
The correlation between price versus star rating is weak and has a very low R-squared value for all price ranges. However, what we understand from the data is that the direction of the relationship changes when the price goes up. When the price is under $30 the relationship was negative, while price become over $30 the relationship changed to positive.
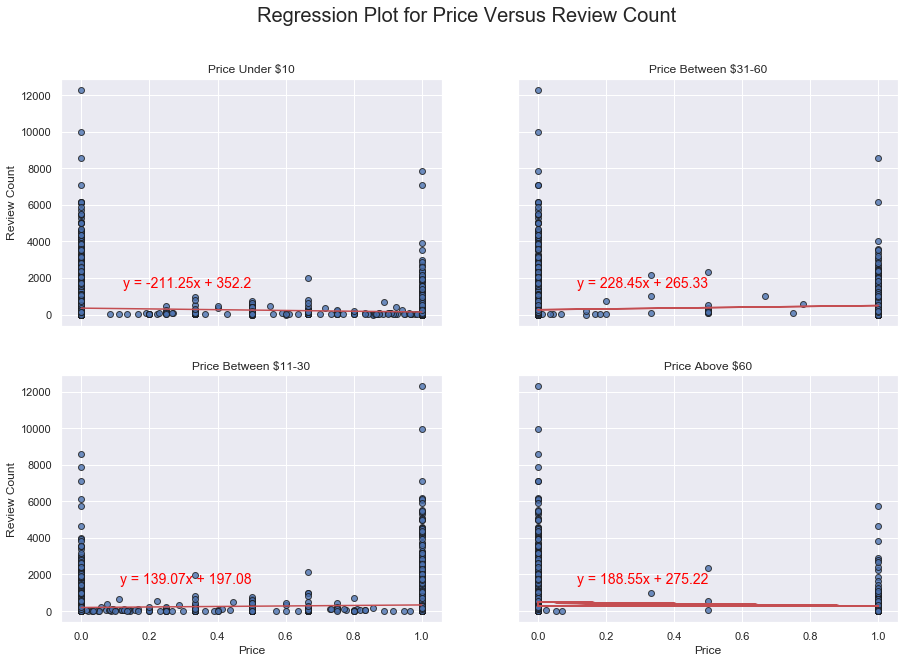
The correlation between price versus Review Count is a very weak positive correlation and the data showed a low R-squared value for all price ranges. This may be due to the outlier data points in review counts.
- The average star rating of restaurants is 3.61, which is a good indication of restaurants in the selected locations has a good service.
- Other things remains constant from this research findings it is understood that there is a very weak positive correlation between star ratings , and review couts. It is also difficult to model, and predict the data on this relationships at the moment.
- The other interesting finding of this project is the relationship between price and star rating. However, there is a very weak correlation, and regression value to predict rating on restaurants price range, but the direction of the relationship start changing when the price go up. When price is under $30 the relationship was negative, while price is going up from $30 the relationship become positive.
- It is too crude to assume all the restaurant data points as one sample, because some data systematically variate from other data. The fundamental structure of the dataset should be grasped first before further, finer analysis.
- The top restaurant in terms of review count is Katz’s Delicatesse with 21,803 reviews, located in Manhattan, New York City, and the lowest one is Tacos El Bombon with 1 review count, and it is located in Los Angeles, California.
- The top restaurant in terms of both review count, and star rating is Tropicali with 1126.0 review count and 5 star rating. New York get the highest average reviews count(905) and East York, ON get the highest average rating (4.5) and review count(259)
- One of the limitation of this study is the review cout data has outliers. Our outlier testing also showed that there is upper hand outliners. The median is 91 the upper outlier is 12280. We are tempted to remove the outliers ,outliers increase the variability of the data, which decreases statistical power. In the next research if we take appropriate sample and remove the outliers we can get a better result to conclude.
- Adedamola Atekoja (‘Damola)
- Amanda Qianyue Ma
- Amos Johnson
- Ermias Gaga

