We propose a novel trend factor for the Chinese stock market, which incorporates both price and volume information to capture dominant individual trading, momentum, and liquidity. We find that volume plays a more significant role in the trend factor for China than for the US, reflecting the greater retail participation in China. By incorporating this trend factor into the 3-factor model of Liu et al. (2019), we propose a 4-factor model that explains a wide range of stylized facts and 60 representative anomalies. Our study highlights the important role of individual trading in asset pricing, especially in China.
前后大概肝了1周实现了大部分逻辑,算是比较好的练手,也可以复用。
- close price : MA10 , MA400
- scaled by the price at
$t$ to make it stationary
- scaled by the price at
- volume : MA10 , MA400
- RMB amount in fact
- scaled by the amount at
$t$ to make it stationary
- finacial data: size, ep
- 要注意大部分的财务数据源存在数据重复问题,只能用最近一次发布的当期财务指标来避免lookahead
Need align to month, and avoid lookahead bias.
- return : return in
$t+1$ month
- 使用上面的数据滚动训练LR
- 每个月都能获得一组参数
$\beta$ - 使用超参
$\lambda$ 对$\beta$ 做EMA,超参优化逻辑是计算使收益最大化的值- 原文中没有写优化超参的portfolio如何构造,只说构造了100组(对应$\lambda$ 值的trend portfolios), 选择使sharpe ratio 最大的$\lambda$ . 有可能是进行了分组,计算high 部分的收益?可是说不太通
- 原文给出前6个月在0.01~0.02 震荡,然后收敛到0.01 ,为了简单直接用0.01
- 使用EMA平滑的$\beta$ 带入模型输出就是ERTrend
As a result, the intersections of those groups produce 18 (2 × 3 × 3) Size-EP-Trend portfolios, among which there are 9 portfolios in the Size-Small (Size-Big) group, 6 portfolios in the EP-Low (EP-Mid and EP-High) group, and 6 portfolios in the Trend-Low (Trend-Mid and Trend-High) group
每月计算一次ERTrend 然后分组后计算收益,可以肯定避免了lookahead bias.
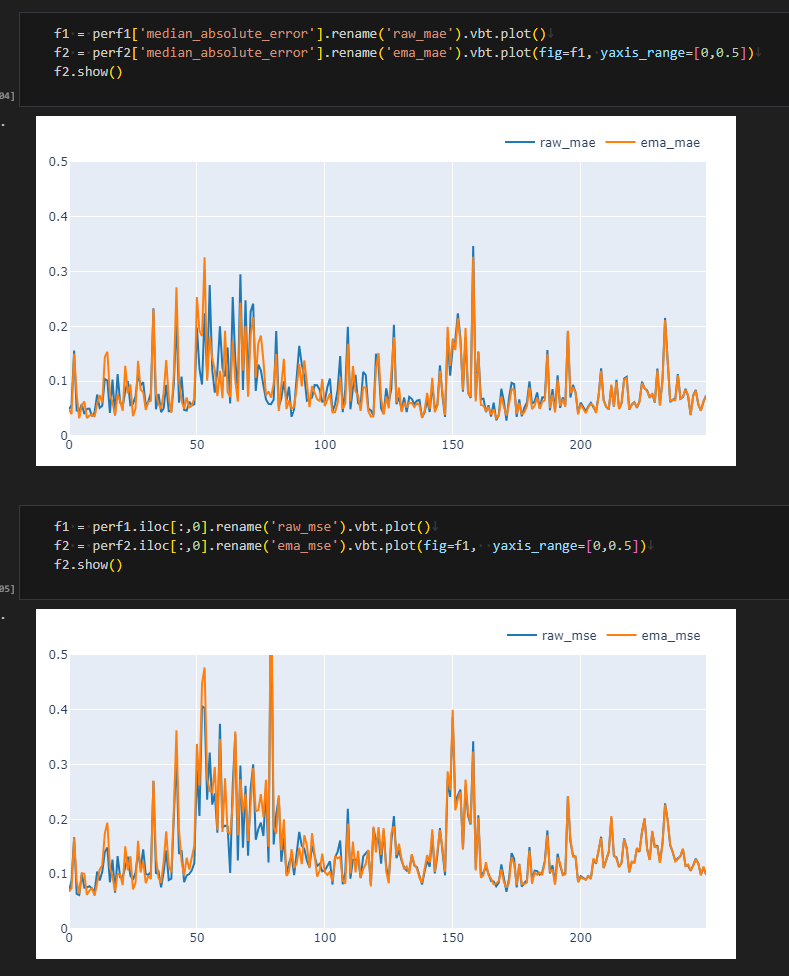
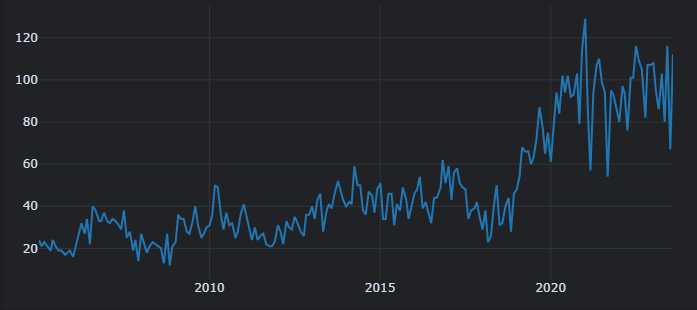
- 可能是因为我没有对在startup 对$\lambda$ 进行优化,导致前期预测不理想,后期可以看到基本重合
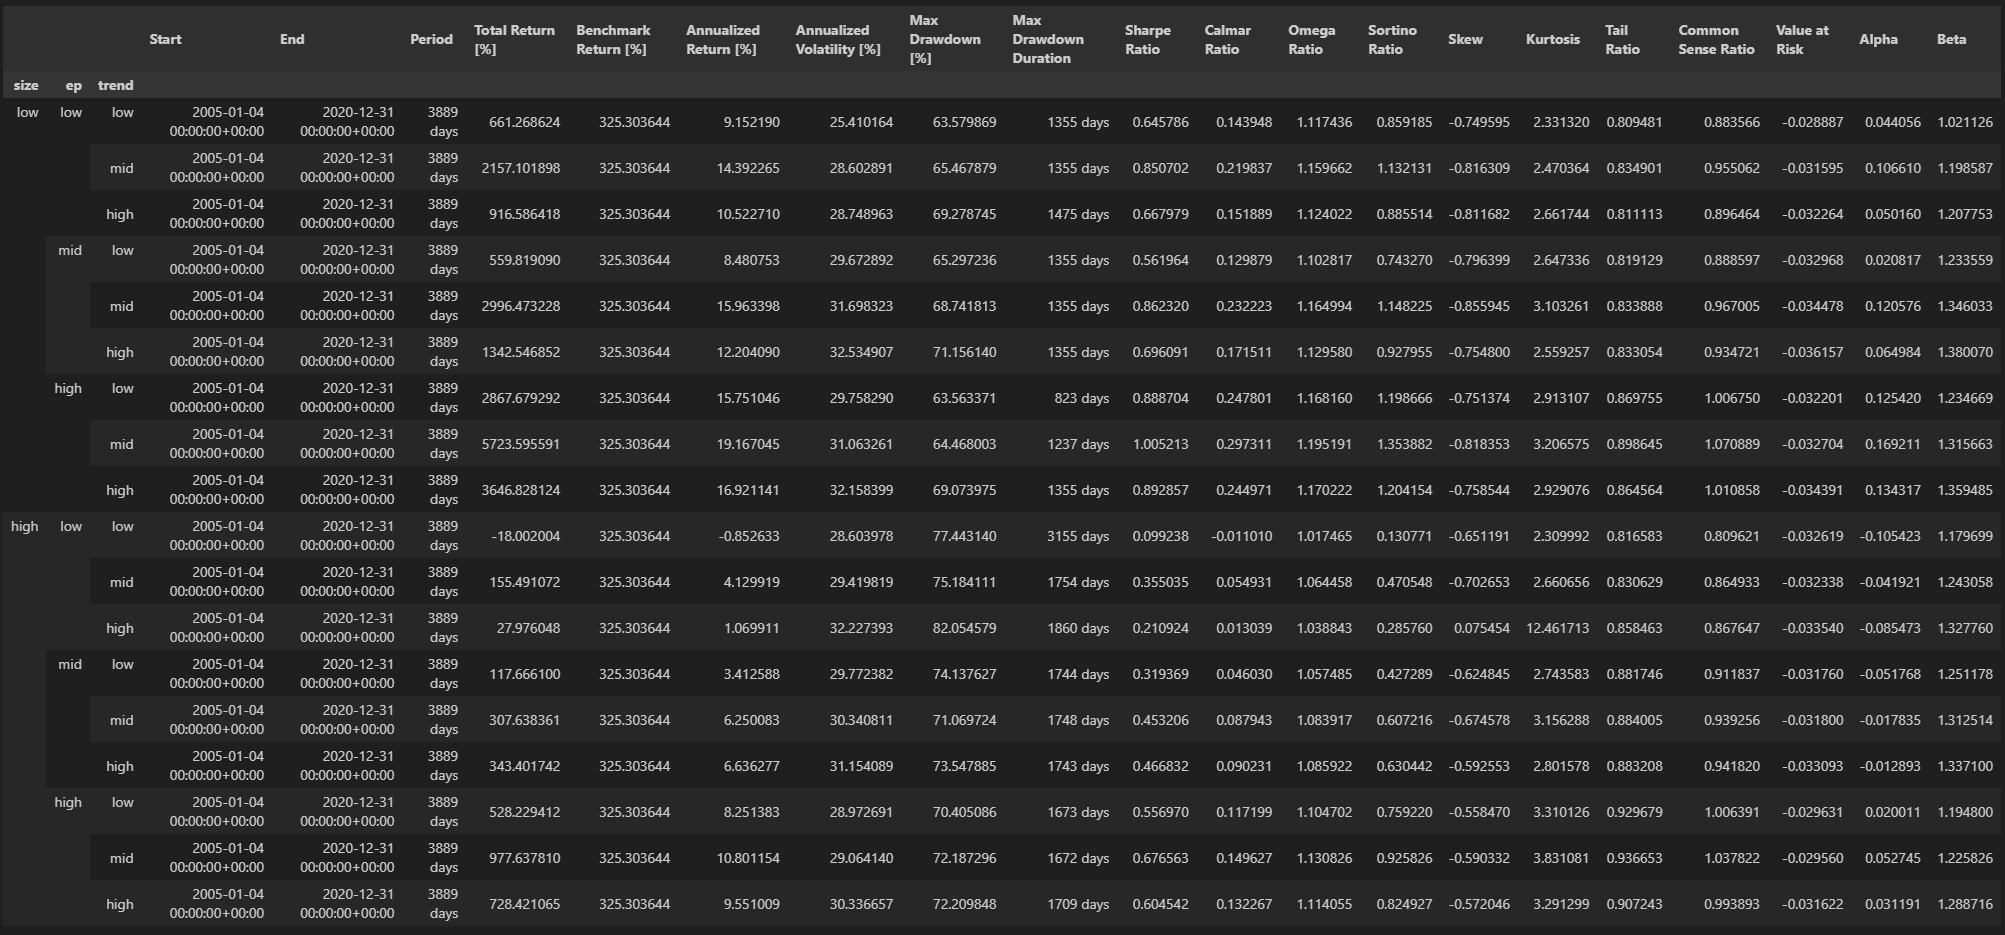
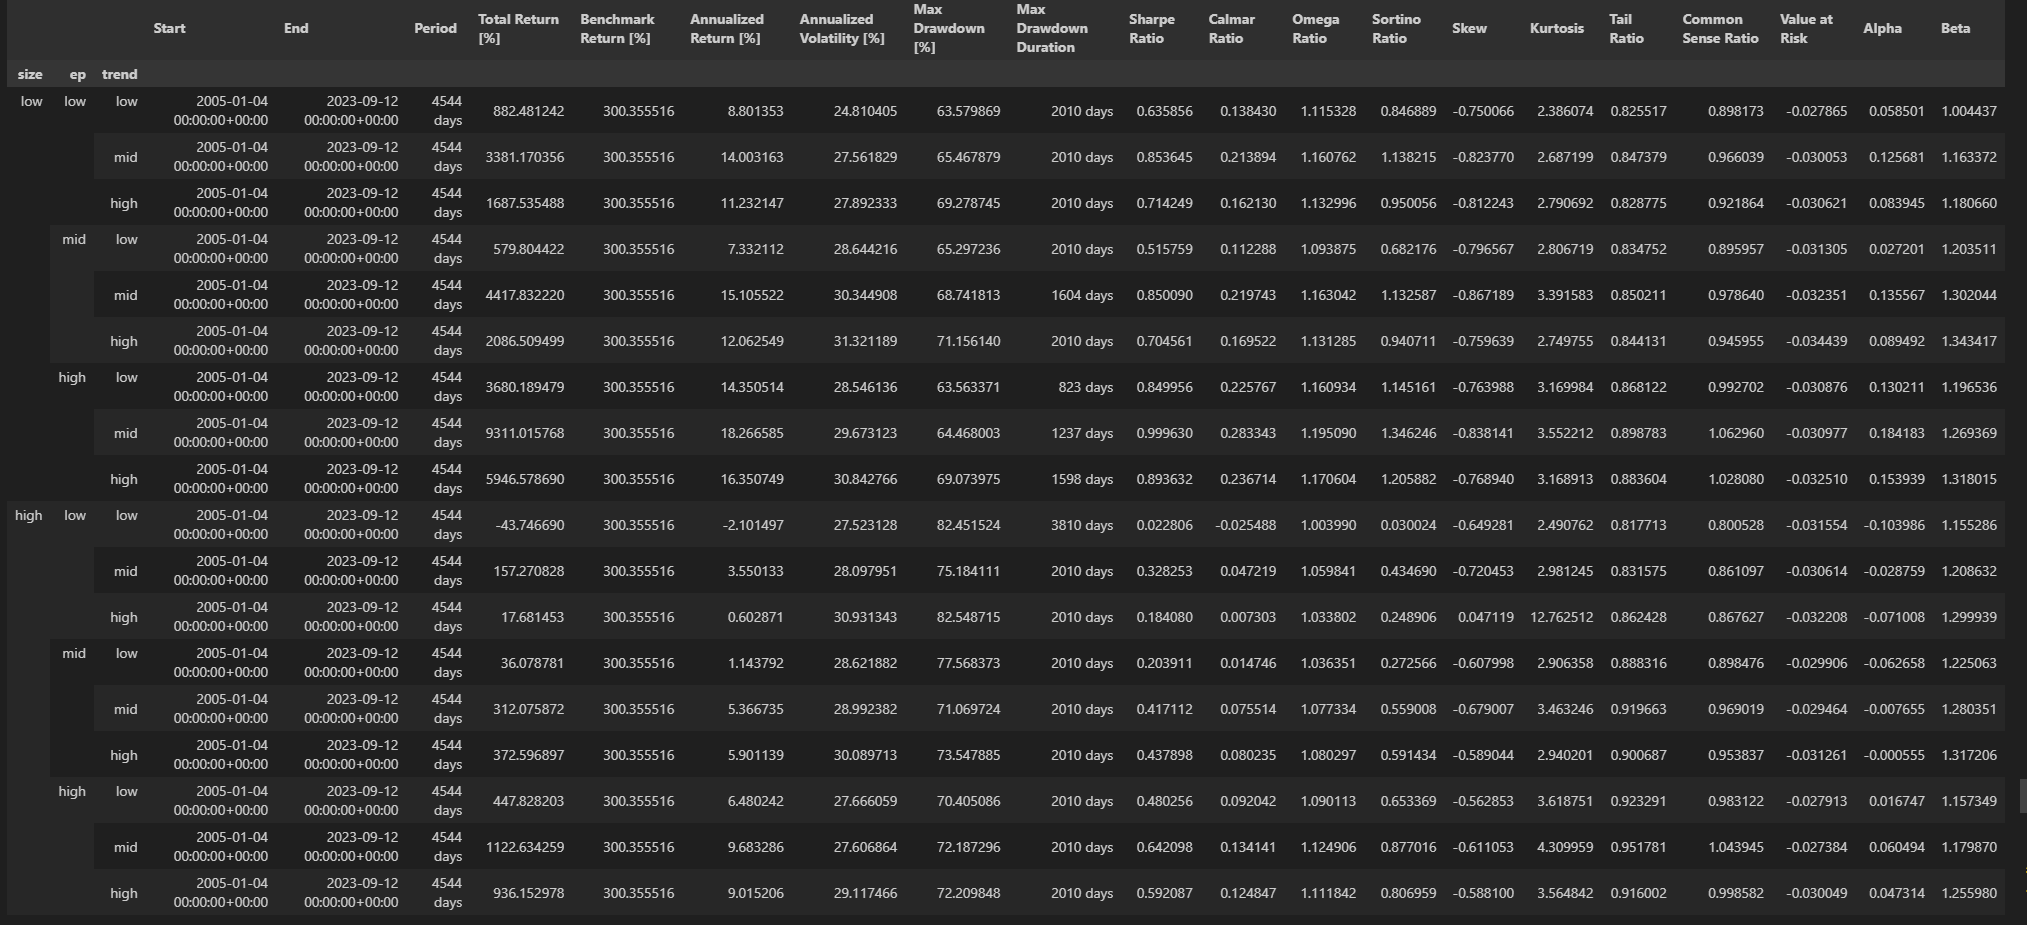
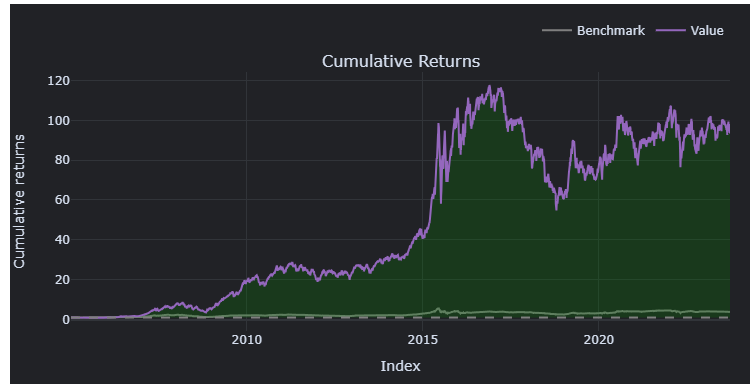
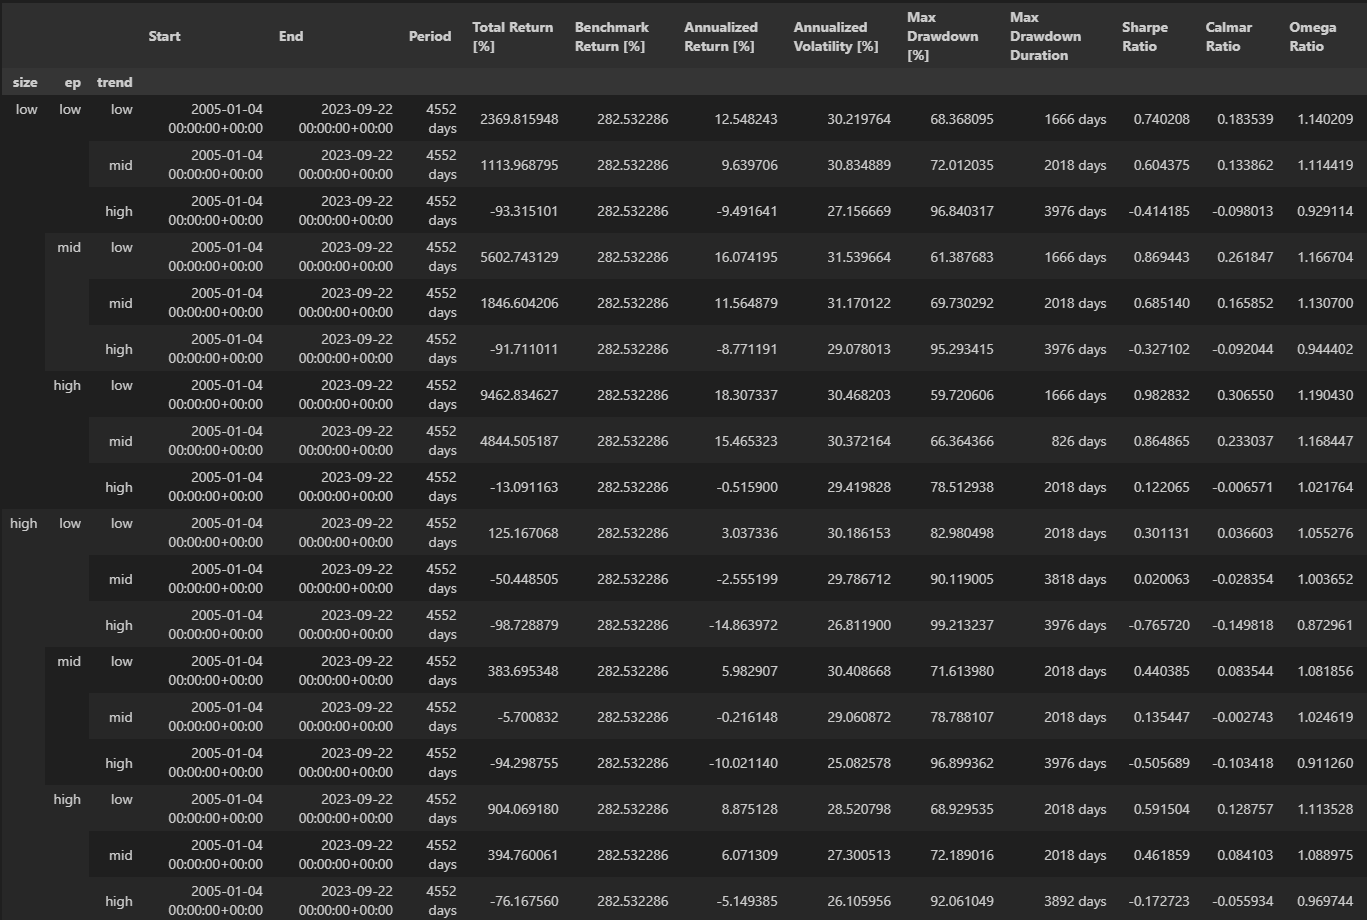
与原文不同,(low,high,mid) 这个分组出现了最高的年化收益。
不一致原因分析:
-
$\lambda$ 没使用原文的优化逻辑 - 计算的是均仓买入的收益,原文中是value-weighted (VW) returns(按照市值的比例来购买股票),我使用vm return 计算的回报比均仓低不少。
- 原文的size 分组使用的是A+B+H股总市值,我只使用了A股的市值。
- 没有包含退市股票
- 原文的warmup可能和我不一致,原文使用38个月数据warmup
$\beta$ 然后在2005年开始测试,我的逻辑类似但是细节实现估计不同。 - 财务数据源中的季度扣非净利润的数据可能不一致,我从tushare获取并经过处理,原文作者是从wind获取的。
可以看到 low,high,mid 月收益是最高的。 Trend-High 部分都少了1个点左右,可能是因为前述的一些原因。
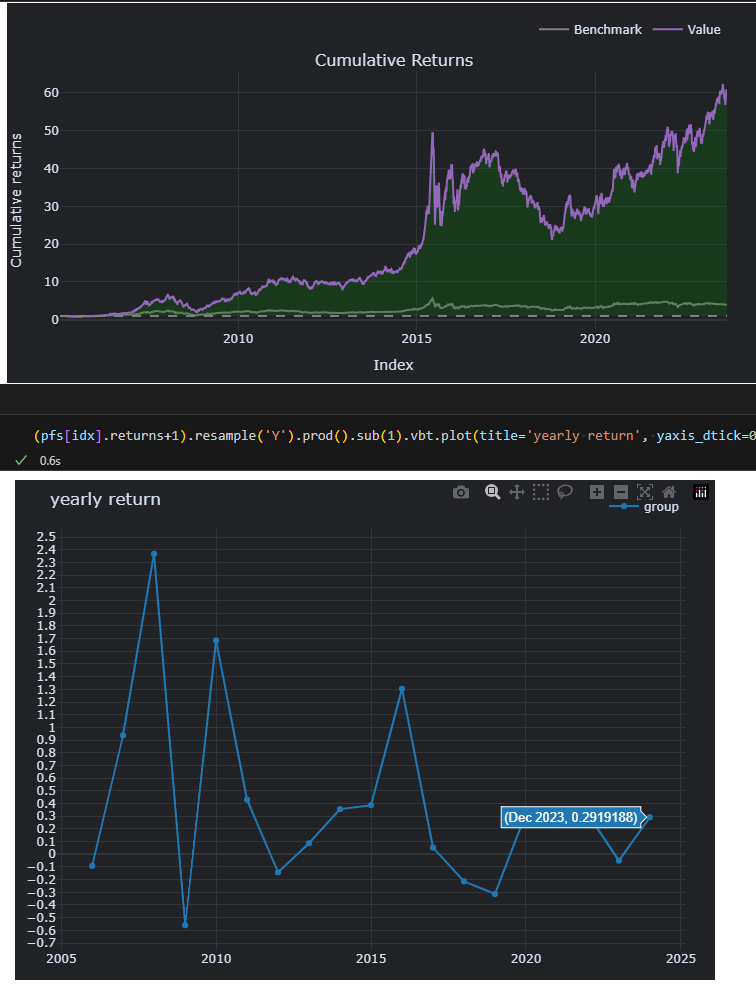
可以看到2023年虽然整体表现不好,但是这个收益率却是不错的。
需要警惕的是投资组合较多,资金需求量可能较大。 且可能有一些股票的流动性不足以买入足够数量。
- 使用其他指标分组
- 更细粒度的分组
- 增加分组或者过滤条件(过滤st,低流动性等)
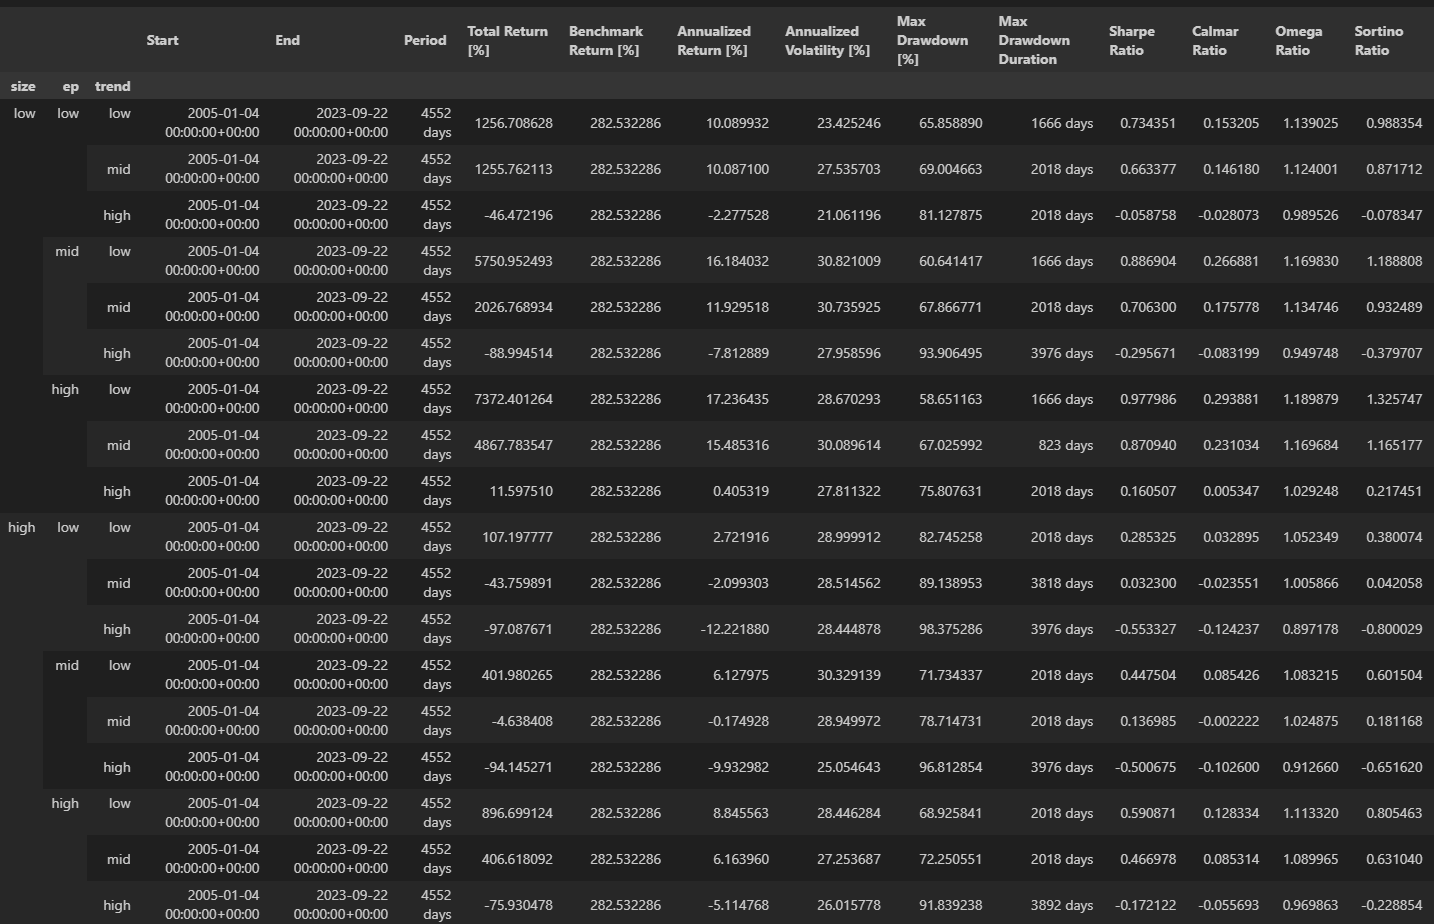
发现low,high,low 的收益要月高于其他的策略,这代表了短期趋势trend更可能反转
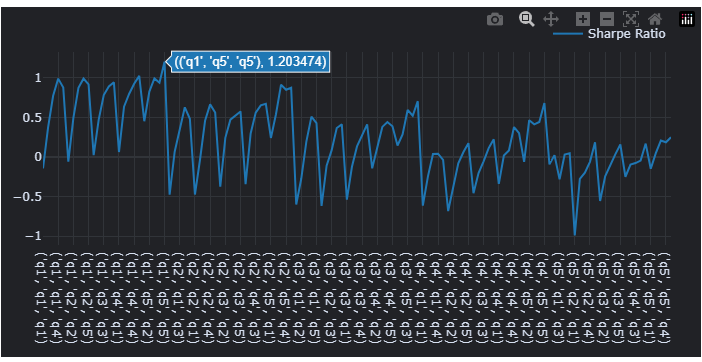
size, ep, ertrend 按5等分分组,使用vwap 作为价格计算ma10和ma400 以及回测数据
这样就比较明显,小市值 大ep 大ertrend 的回报较高
