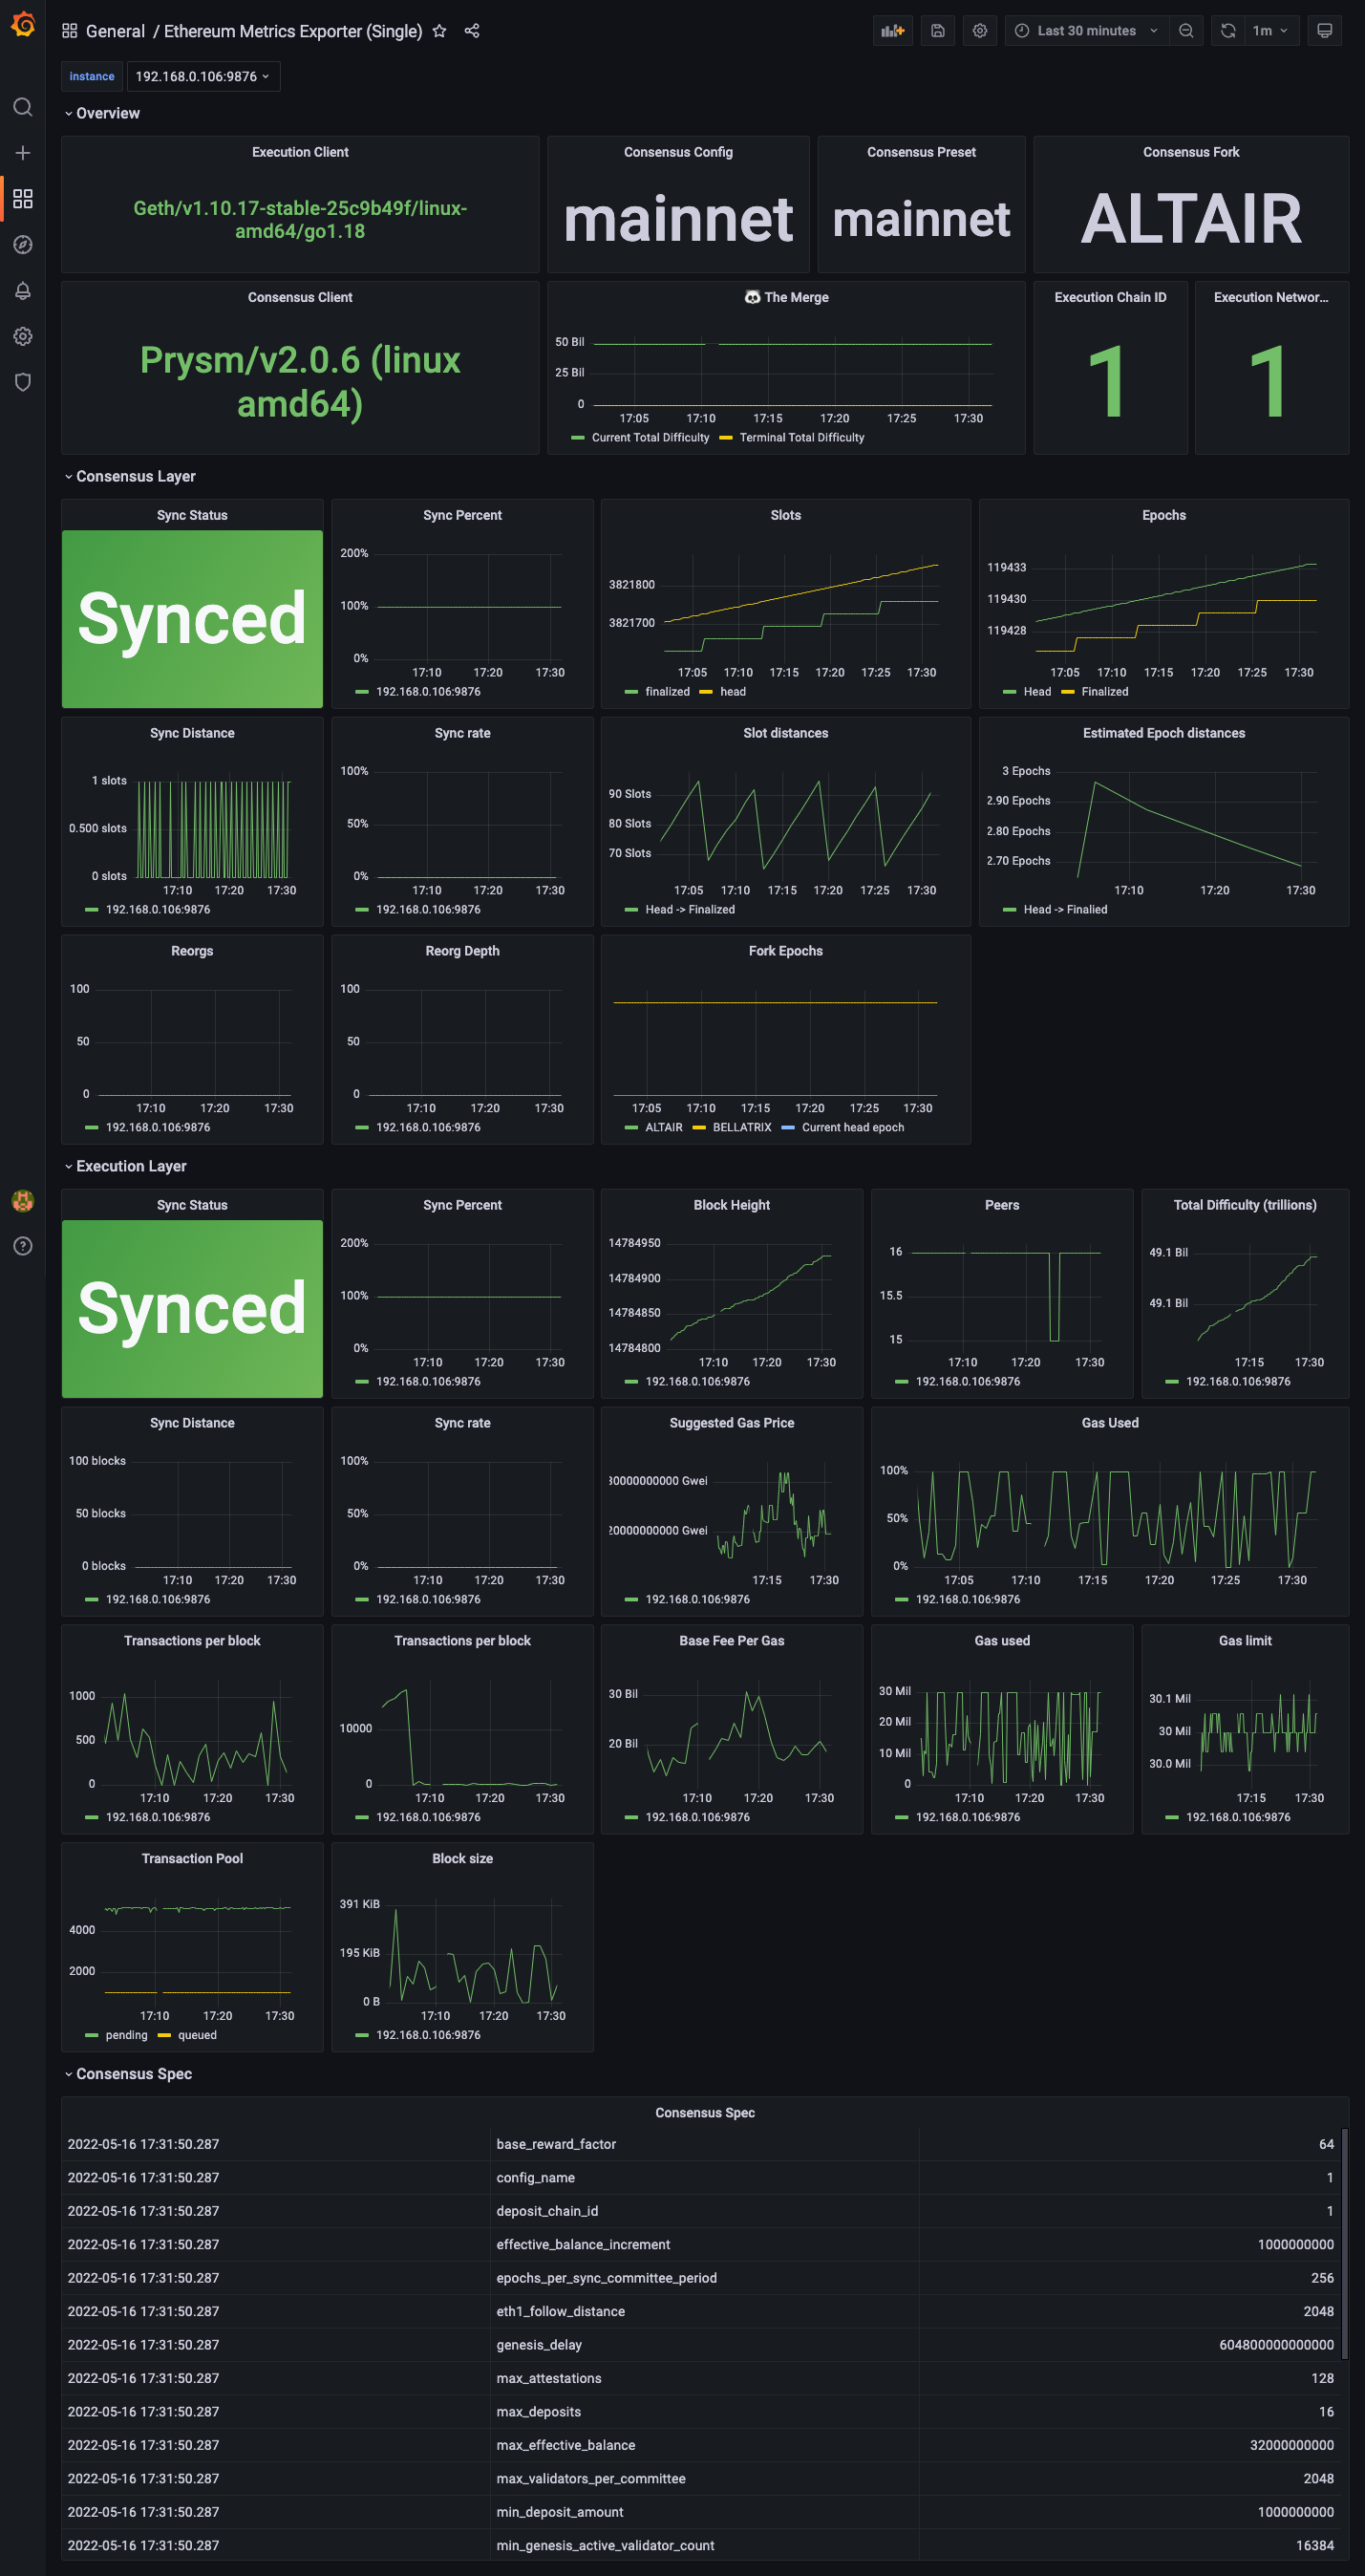
A Prometheus metrics exporter for Ethereum execution & consensus nodes
Ethereum client implementations expose extensive Prometheus metrics however there is minimal standardization around the metrics structure. This makes observability across multiple clients a painful experience. This exporter hopes to help alleviate this problem by creating a client-agnostic set of metrics that operators can run without any additional configuration to dashboards or alerting.
To provide these client-agnostic metrics the exporter relies entirely on these well-defined APIs:
- Execution clients
- Consensus clients
Naturally this means that the exporter is limited to metrics that are exposed by these APIs.
A tool to export the state of ethereum nodes

Usage:
  ethereum-metrics-exporter [flags]

Flags:
      --config string                   config file (default is $HOME/.ethereum-metrics-exporter.yaml)
      --consensus-url string            (optional) URL to the consensus node
      --execution-modules strings       (optional) execution modules that are enabled on the node
      --execution-url string            (optional) URL to the execution node
  -h, --help                            help for ethereum-metrics-exporter
      --metrics-port int                Port to serve Prometheus metrics on (default 9090)
      --monitored-directories strings   (optional) directories to monitor for disk usage
  -t, --toggle                          Help message for toggle
Available as a docker image at ethpandaops/ethereum-metrics-exporter
latest- distroless, multiarchdebian-latest- debian, multiarch$version- distroless, multiarch, pinned to a release (i.e. 0.4.0)$version-debian- debian, multiarch, pinned to a release (i.e. 0.4.0-debian)
Quick start
docker run -d -it --name ethereum-metrics-exporter -p 9090:9090 -it ethpandaops/ethereum-metrics-exporter --consensus-url=http://localhost:5052 --execution-url=http://localhost:8545
With a config file
docker run -d -it --name ethereum-metrics-exporter -v $HOST_DIR_CHANGE_ME/config.yaml:/opt/exporter/config.yaml -p 9090:9090 -it ethpandaops/ethereum-metrics-exporter --config /opt/exporter/config.yaml
helm repo add ethereum-helm-charts https://ethpandaops.github.io/ethereum-helm-charts

helm install ethereum-metrics-exporter ethereum-helm-charts/ethereum-metrics-exporter -f your_values.yaml
Downloading a release Available here
Building yourself (requires Go)
- Clone the repo
go get github.com/ethpandaops/ethereum-metrics-exporter
- Change directories
cd ./ethereum-metrics-exporter - Build the binary
go build -o ethereum-metrics-exporter . - Run the exporter
./ethereum-metrics-exporter
Contributions are greatly appreciated! Pull requests will be reviewed and merged promptly if you're interested in improving the exporter!
- Fork the project
- Create your feature branch:
git checkout -b feat/new-metric-profit
- Commit your changes:
git commit -m 'feat(profit): Export new metric: profit
- Push to the branch:
-
git push origin feat/new-metric-profit - Open a pull request
Sam - @samcmau
