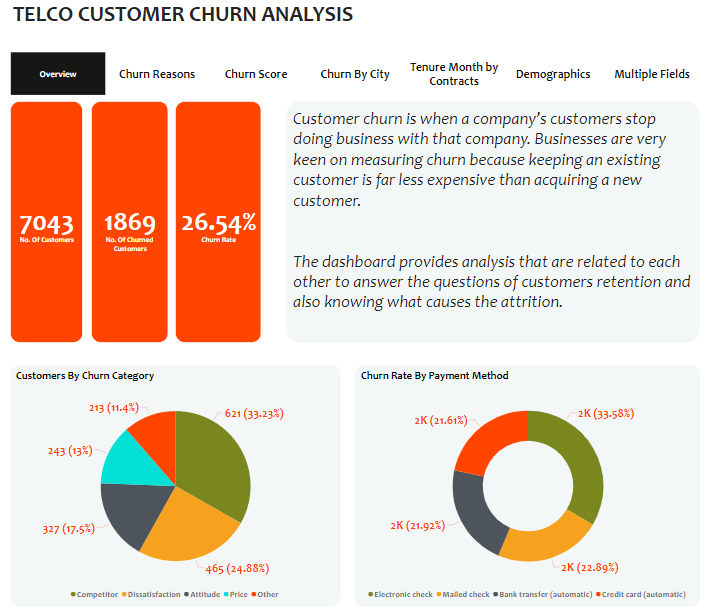
This is a Power BI projects on Telco Customer Churn Analysis of a dummy dataset.In this documentation, we will explore a telco churn analysis, aiming to know why customer churn in a telecommunications company. By identifying customers who are likely to churn, the company can take proactive measures to retain them and improve customer satisfaction. The analysis will involve various stages, including data sourcing, data transformation, modeling, analysis and visualizations, and concluding with recommendations.
Disclaimer : All datasets and reports do not represent any company, institution or country, but just a dummy dataset to demonstrate capabilities with Power Bi.
The problem we are addressing is the prediction of customer churn in a telecommunications company. Customer churn refers to the phenomenon of customers ending their relationship with a company or service. By predicting churn, the telco company can take appropriate actions to prevent customer attrition and minimize revenue loss. The goal is predicts which customers are likely to churn based on historical data analysed. This will be done by :
- Investigating Churn reasons and churn categories
- Investigating churn patterns by analyzing demographics, contract types and payment method.
- Investigating churn score
The following Power BI features were incorporated:
- Data Transformation
- Measures
- Power Query
- Tooltips
- Page Navigation
- Analysis & Visualization
No modelling was needed for the dataset
The report comprises of 7 pages:
- Overview
- Churn Reasons
- Churn City
- Churn Score
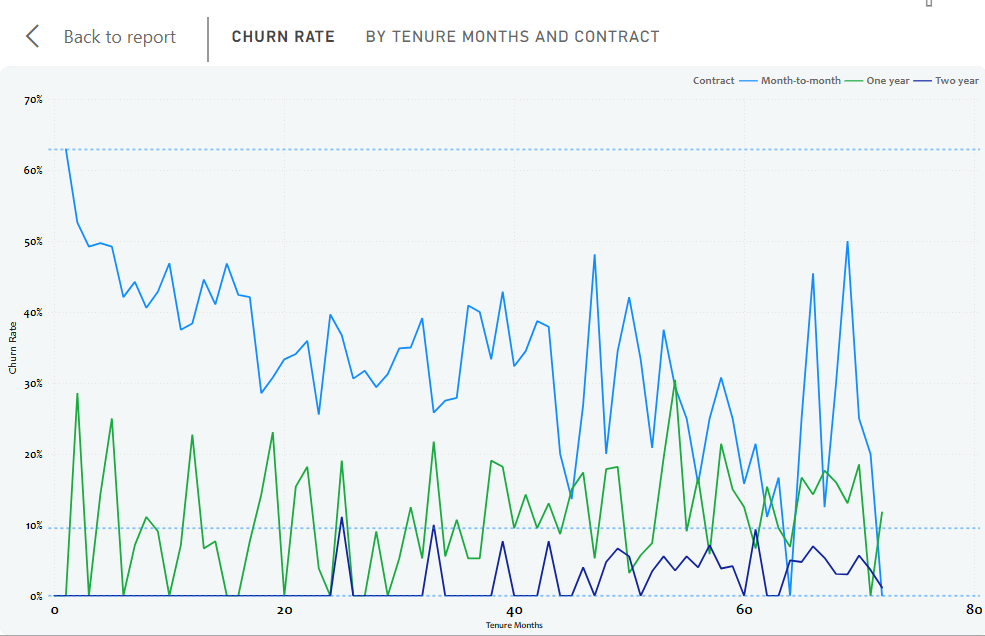
- Tenure Months By contracts
- Demographics
- Multiple Fields
You can interact with the report here
- The seven tabs are buttons with hovering effect and each navigates to the page with similar name.
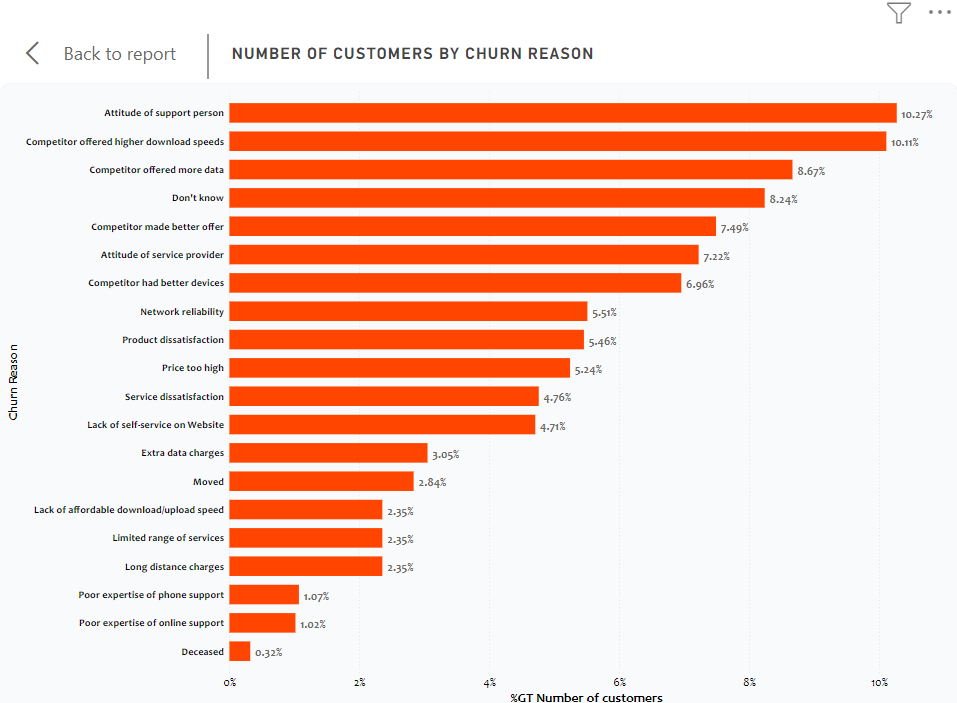
The highest churn reason is; "attitude of support persons", with 10.27% attrition rate followed by; "competitor offered higher download speeds".The reason for this analysis, is simply because , the best way to know how to stop churning, is to actually know the reasons for the attrition. If we dig deeper by categorising these reasons we will further get more insights concerning the reasons.
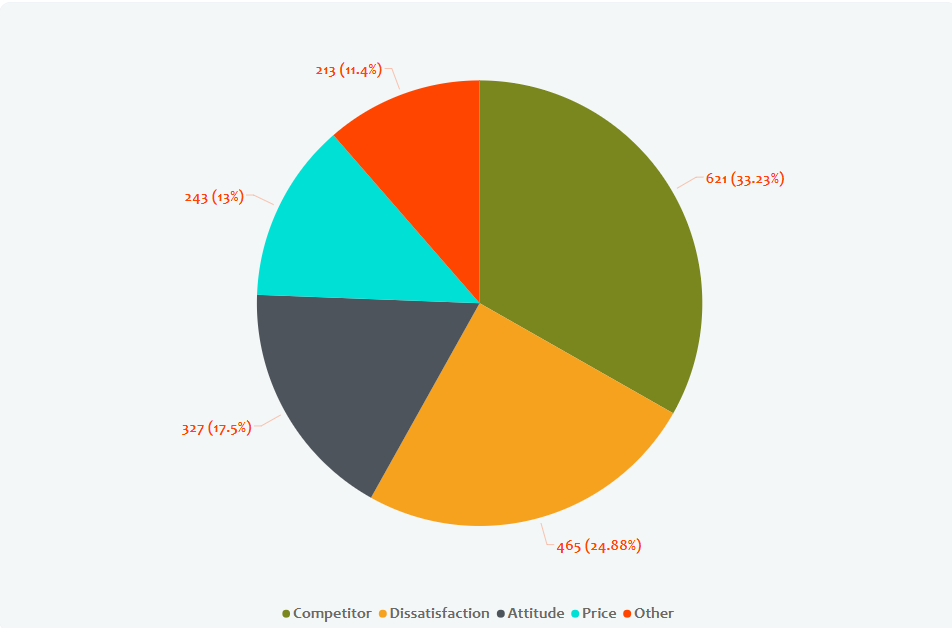
The competitor category for churn reasons has highest churn rate which is 33.23%, meaning 33.23% churn rate of customers are related to what the competitor offers, seconded by dissatisfaction of the telco services which is 24.88%. Now we know where to look and focus efforts on.
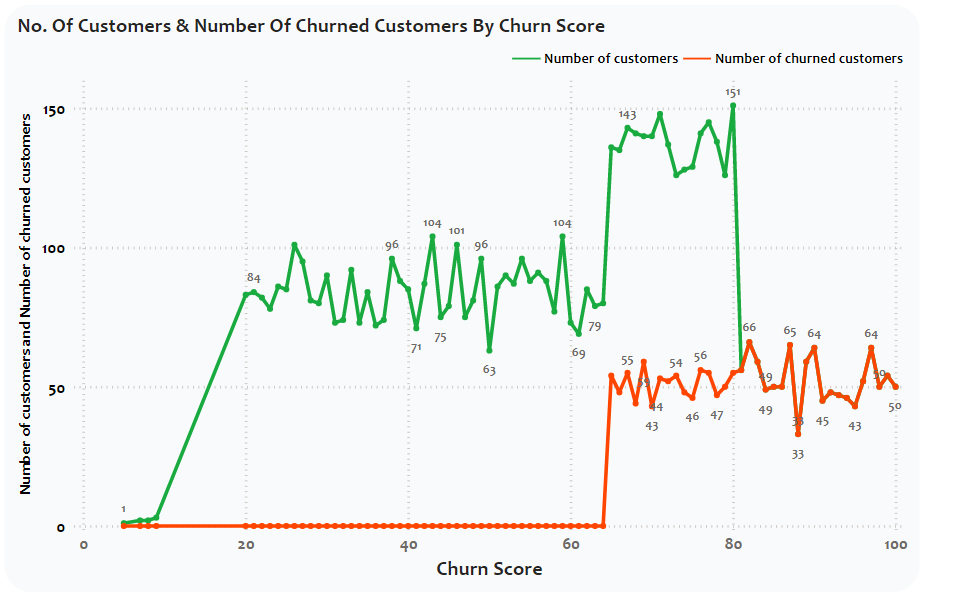
This is a value from 0-100 that is calculated using the predictive tool IBM SPSS Modeler. The model incorporates multiple factors known to cause churn.The higher the score, the more likely the customer will churn.
According to the line chart analysis, customers started churning when the churn score was 65, also we can see from the line chart at churn score 67, number of customers are 143 and number of churned customers are 55.
Through this we can analyse customers that are likely to churn and provide a solution that will stop the potential attrition.
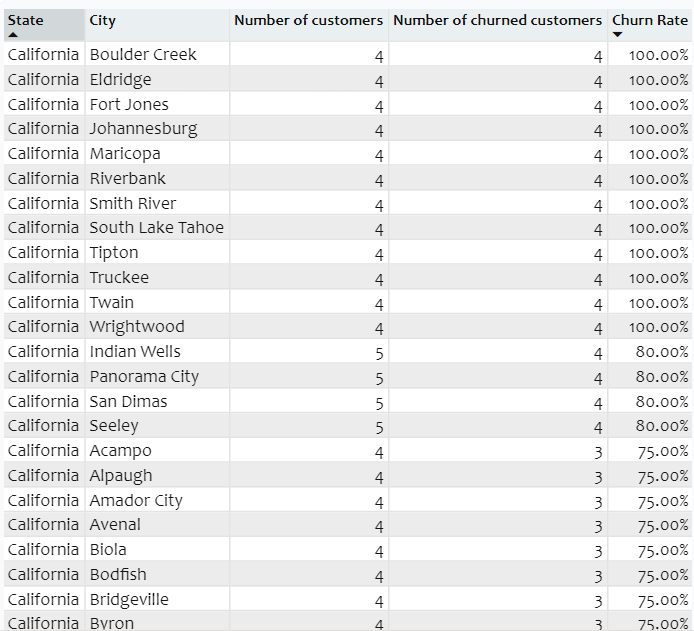
| Churn City Table | Churn City Map |
|---|---|
 |
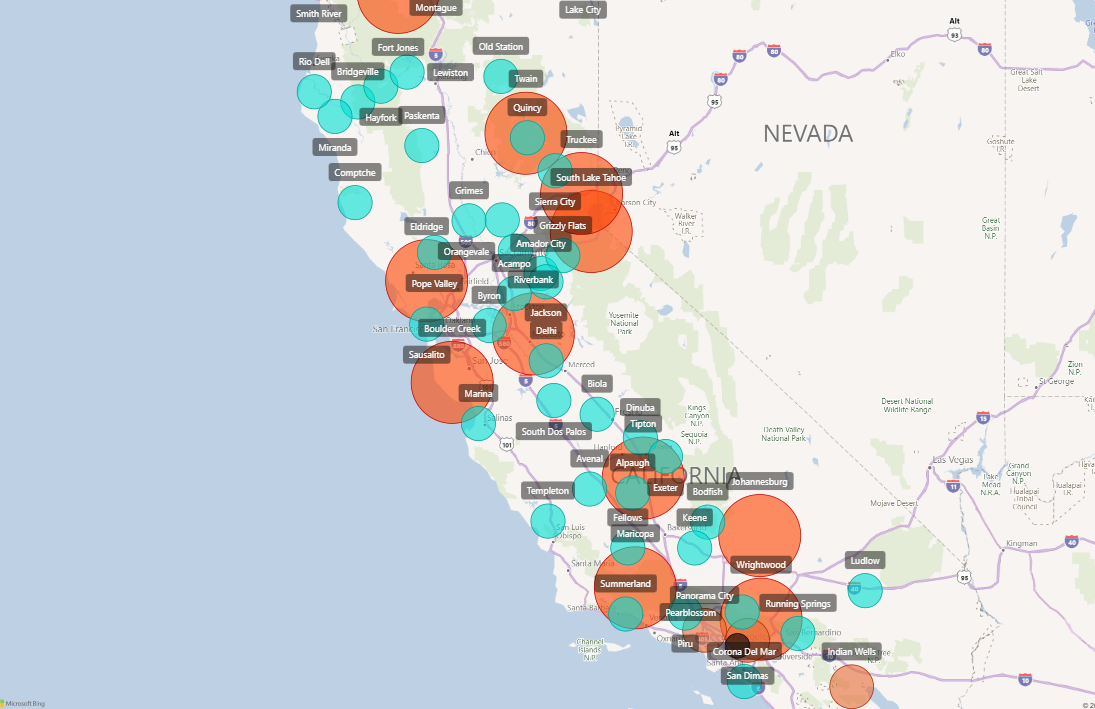 |
There are churn rate of 100% in Ten different cities, but those churn rate have 4 customers and 4 churned customers. This might indicating less populous, but if we look at the big cities by filtering the table by number of churned customers instead of churn rate, we will start seeing numbers.
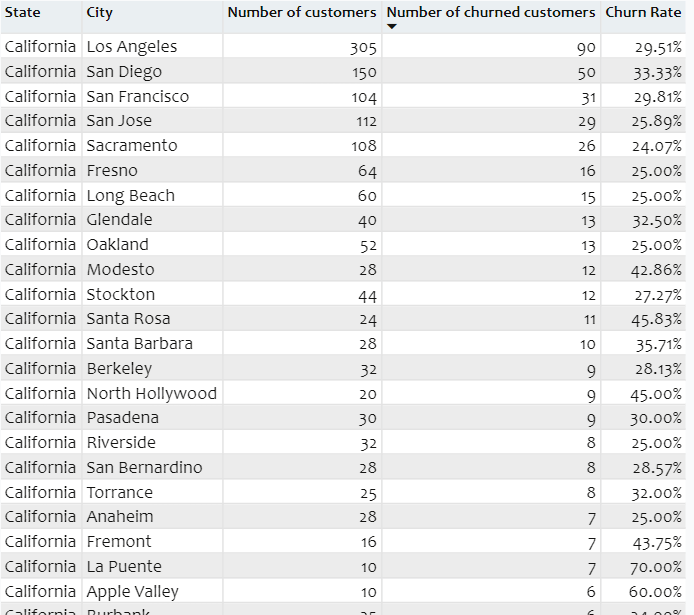
| Churn City Table | Churn City Map |
|---|---|
 |
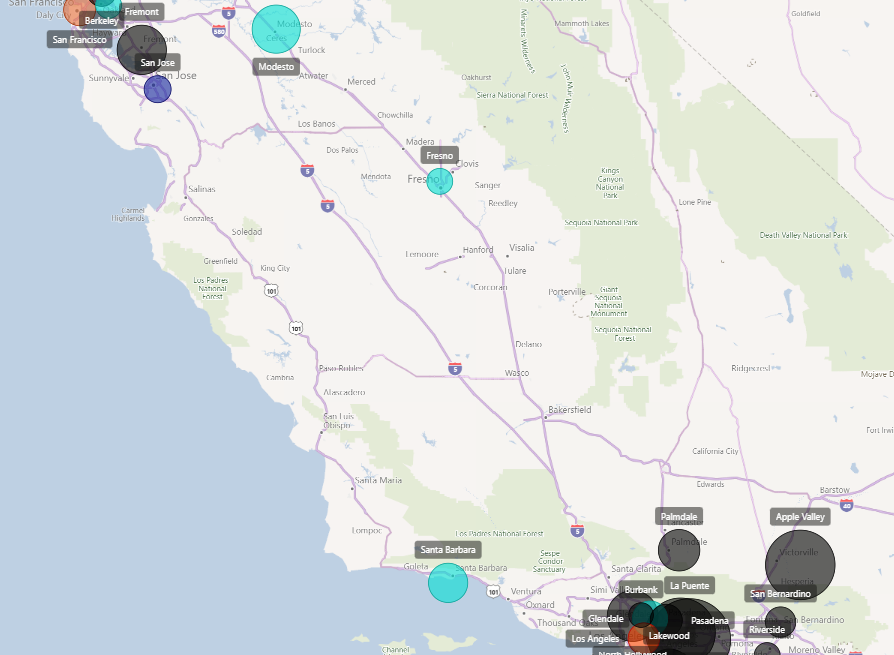 |
We can now see that Los Angeles has the highest number of churned customers, with 90 churned customers out of 305 customers, which also the highest number of customers per city.

