The goals / steps of this project are the following:
- Load the data set (see below for links to the project data set)
- Explore, summarize and visualize the data set
- Design, train and test a model architecture
- Use the model to make predictions on new images
- Analyze the softmax probabilities of the new images
- Summarize the results with a written report
I used the pandas library to calculate summary statistics of the traffic signs data set:
- The size of training set is 34799
- The size of the validation set is 4410
- The size of test set is 12630
- The shape of a traffic sign image is 32, 32
- The number of unique classes/labels in the data set is 43
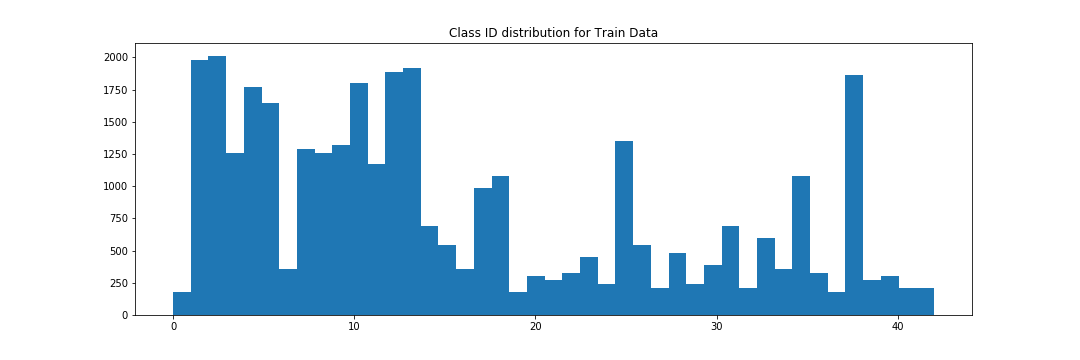
Here is an exploratory visualization of the data set. It is a bar chart showing how the class id distributed for the training data set.
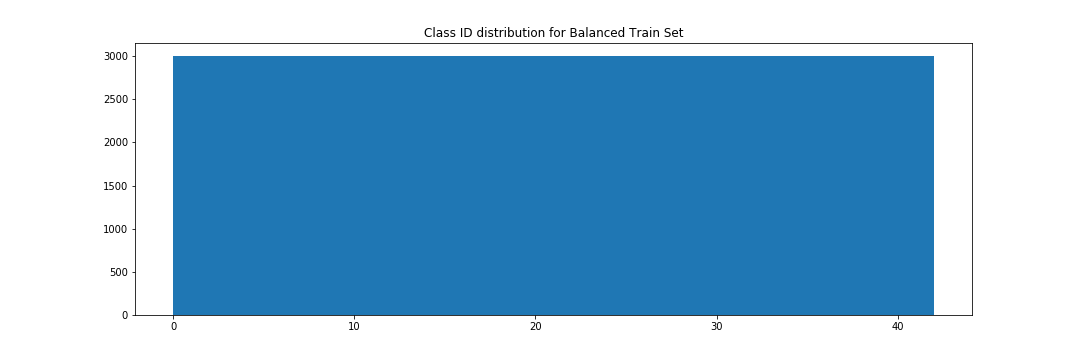
Here is an exploratory visualization of the data set after applying data set balancing by class id.

- Describe how you preprocessed the image data. What techniques were chosen and why did you choose these techniques? Consider including images showing the output of each preprocessing technique. Pre-processing refers to techniques such as converting to grayscale, normalization, etc. (OPTIONAL: As described in the "Stand Out Suggestions" part of the rubric, if you generated additional data for training, describe why you decided to generate additional data, how you generated the data, and provide example images of the additional data. Then describe the characteristics of the augmented training set like number of images in the set, number of images for each class, etc.)
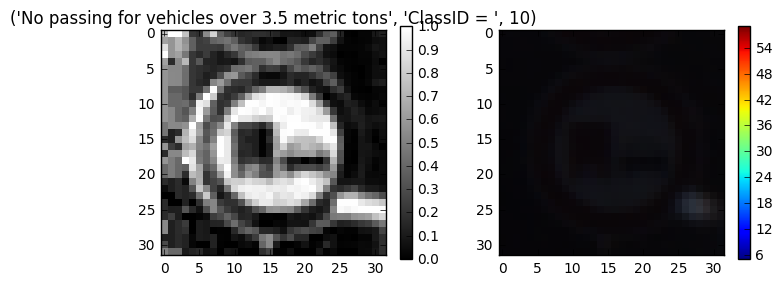
As a first step, I decided to work with RGB images and perform several tests. As a result, I found that RGB way lead to the overfitting the network. After that, I decided to pickup a several techniques to solve that issue. It is grayscaling and normalization.
Here is an example of a traffic sign image before and after grayscaling.
Also I decided to generate additional data because if you check histogram of class distribution in the training set, you will see that quantity of some classes significantly more than other.
So I balanced classes to 3000 images of each class.
I tried to augmented images, like apply rotations, adding noises, blurring and etc but that approach didn't improve the test accuracy and performance. So I decided don't use it at all.
So difference between the original data set and the augmented data set is the following: the training set balanced by class id distribution.
- My final model consisted of the following layers:
| Layer | Description |
|---|---|
| Input | 32x32x1 Grayscale image |
| Convolution 5x5 | 1x1 stride, valid padding, outputs 28x28x24 |
| RELU | |
| Max pooling | 2x2 stride, outputs 14x14x64 |
| Convolution 5x5 | 1x1 stride, valid padding, outputs 10x10x64 |
| RELU | |
| Max pooling | 2x2 stride, outputs 5x5x64 |
| Flattened | outputs 1600 |
| Fully conneced | input 480, output 84 |
| RELU | |
| Dropout | 0.5 |
| Fully connected | input 84, output 43 |
| Softmax with Cross Entropy | etc. |
- Describe how you trained your model. The discussion can include the type of optimizer, the batch size, number of epochs and any hyperparameters such as learning rate.
To train the model, I used an AdamOptimizer function with 50 epochs or batch size 128. I tried many different combinations of epochs and batch sizes and found this to be the best in terms of time to train and accuracy achieved. I used a learning rate of 0.0005.
- Describe the approach taken for finding a solution and getting the validation set accuracy to be at least 0.93. Include in the discussion the results on the training, validation and test sets and where in the code these were calculated. Your approach may have been an iterative process, in which case, outline the steps you took to get to the final solution and why you chose those steps. Perhaps your solution involved an already well known implementation or architecture. In this case, discuss why you think the architecture is suitable for the current problem.
My final model results were:
training set accuracy of 0.999 validation set accuracy of 0.955 test set accuracy of 0.950
As was mentioned before the first adjustments were the grayscaling and normalization to avoiding overfitting with RGB images and speeding up of trainig the model. The next improvement was balancing the training set. After that I've swapped the RELU and maxpooling functions in the my neural network and that gave me some extra points to accuracy. After this I added dropout between each fully connected layers to improve accuracy a little further.
Which parameters were tuned? How were they adjusted and why? I played a lot with learning rate, number of epochs, layers depths and dropouts. It was very hard for my to stop with further new experiments. Because there are remains many other parameters to tune as well as various network configuration but I was limited by time and costs for the AWS instance. I start playing with learning rate 20 and various layer depth. When I found promising configuration I increased quantity of epoch to 50.
What are some of the important design choices and why were they chosen? For example, why might a convolution layer work well with this problem? How might a dropout layer help with creating a successful model?
The convolution is the most important design choice for this application because it preserves the spatial relationship between pixels by learning image features using small squares of input data. I also found dropout to improve accuracy by about 3%.
If a well known architecture was chosen:
What architecture was chosen? I chose LeNet to start with and then added some convolution layers between pooling.
Why did you believe it would be relevant to the traffic sign application? Based on the lessons LeNet seemed to be an obvious choice for image data of the traffic signs. Especially considering the common shapes involved with a traffic sign.
How does the final model's accuracy on the training, validation and test set provide evidence that the model is working well? The accuracies on the training (0.999) and validation (0.955) are within 4.4% of each other, while the test accuracy (0.950) is within 0.54% of validation. This led me to believe that the model is a bit overfit but could be quite good for a new images.
###Test a Model on New Images
####1. Choose five German traffic signs found on the web and provide them in the report. For each image, discuss what quality or qualities might be difficult to classify.
Here are five German traffic signs that I found on the web:
The first image might be difficult to classify because it contains word "Zone" and looks slightly different from the images which were used for training the model. This is what I saw as a result of the tests of many models.
The second image contains some parts of other objects which the model could treat as a part of sign.
The Road work image there are some perspective distortions. Similarly, the image of a working person may be looks like a child crossing the road.
Two last signs have contrasted background and part of the sign below it. This could have led to confusion for the model but based on the softmaxes it was very certain.
2. Discuss the model's predictions on these new traffic signs and compare the results to predicting on the test set. At a minimum, discuss what the predictions were, the accuracy on these new predictions, and compare the accuracy to the accuracy on the test set (OPTIONAL: Discuss the results in more detail as described in the "Stand Out Suggestions" part of the rubric).
Here are the results of the prediction:
| Image | Prediction |
|---|---|
| Go straight or right | Go straight or right |
| Wild animals crossing | Speed limit (30km/h) |
| Turn right ahead | Turn right ahead |
| Priority road | Priority road |
| Road work | Road work |
The model was able to correctly guess 4 of the 5 traffic signs, which gives an accuracy of 80%. This compares favorably to the accuracy on the test set of 94.4%
3. Describe how certain the model is when predicting on each of the five new images by looking at the softmax probabilities for each prediction. Provide the top 5 softmax probabilities for each image along with the sign type of each probability.
For the first image, the model is make wrong prediction is a speed limit (probability of 0.54). The top five soft max probabilities were
| Probability | Prediction |
|---|---|
| .977 | Keep right |
| .018 | Go straight or right |
| .002 | Stop |
| .002 | Yield |
| .000 | Traffic signals |
For the second image Speed limit (30km/h) the model make right prediction.
| Probability | Prediction |
|---|---|
| .497 | Speed limit (30km/h) |
| .143 | End of all speed and passing limits |
| .093 | Speed limit (20km/h) |
| .081 | Speed limit (60km/h) |
| .063 | Wild animals crossing |


