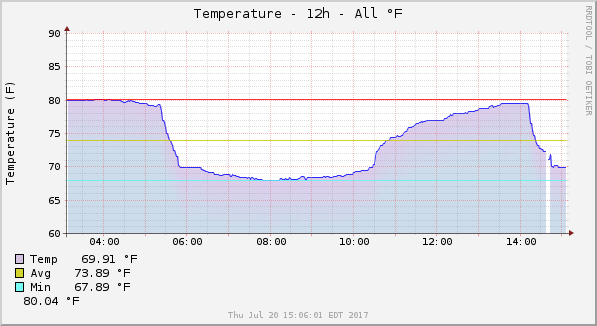
Scripts to record and graph the ambient temperature as read from a TempER USB monitor - http://amzn.to/2iob1ca (OEM is RDing - page here: http://www.pcsensor.com/usb-thermometers/gold-temper.html).
Note: to use Twitter or Slack you'll need to get authentication tokens/API keys. I store them in config.json to keep them out of the scripts themselves.
- Build
temperv14.cfrom home-automation. On Ubuntu this will likely requireapt-get install libusb-dev. Once built, copy temperv14 to/usr/bin. apt-get install rrdtoolto install rrdtool.- Run
create-rrd.shto generate the RRD file. update-temperature.shgets the temperature (in Fahrenheit) and adds it to the RRD. Recommended cron:* * * * *. Requiresrootupdate-graph.shbuilds graphs based on the data in the RRD. Recommended cron:* * * * *twitter.pyposts your chart to Twitter using tweepy. Recommended cron:0 */3 * * *twitter-txt.pyposts the temperature to twitter, as text (pulled from the RRD). Recommended cron:*/10 * * * *slack.pyposts your chart to Slack using Slacker. Recommended cron:0 * * * *