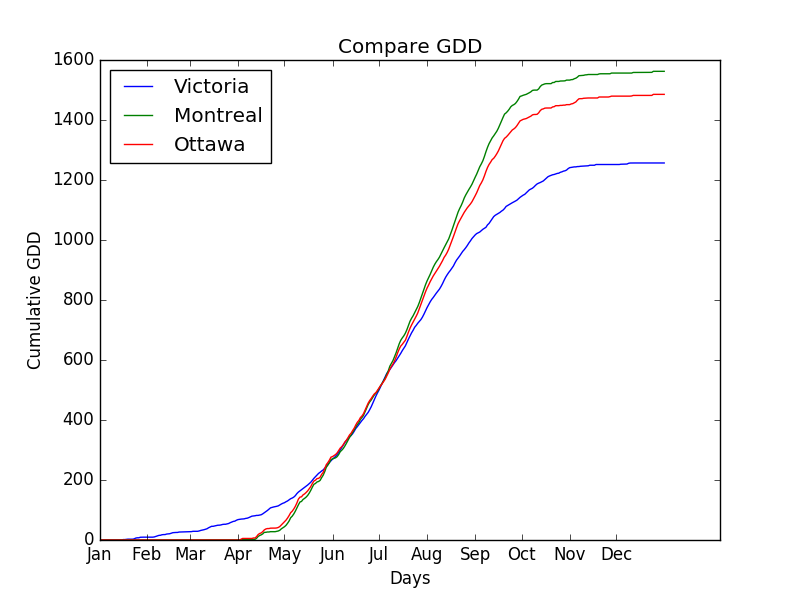
This project aimed to gain experience with computational workflow for a scientific problem in which data was retrieved from the Historical Climate Data from the Government of Canada to calculate the Growing Degree Days (GDD) in three cities: Montreal, Ottawa and Victoria. The GDD is a heat index (heat accumulation) that describes the best timing of biological process such as when a crop will reach maturity, when a flower will bloom, or even when animals will migrate. It is calculated through the formula GDD = [(Tmax + Tmin)/2] - Tbase, in which Tmax and Tmin are the daily maximum and minimum temperatures, and Tbase is the base temperature [1].
- Operating System
- Linux
- Mac
- Windows (maybe)
- Plataforms Anaconda 4.4.0 or higher with:
- Python 3.6 or higher
- mpl_toolkits.Basemap
- sklearn
The entire workflow of this project is done by calling make all, which runs the Makefile and all the scripts to generate the outputs required for this project.
- Clone this repo
git clone https://github.com/evankielley/GDD.git
- Test the
calc_gddfunction
py.test
- In the bash shell:
make clean
make all
- Files
- 2015_cityname_gdd.csv
- Figures
- CompareMaxMinTemp.png
- CumulativeGDD.png
- AnalyzeTbase.png
- gddMapPlotNL.png
- LinReg_Toronto_1960_2015.png
- CanadaBloomingOfMaple.png
- HTML
- OptionalTask1GDDPlot.html
- bokeh_gdd.html
- bokeh_temp.html
- Report
- Report.pdf
- The data retrieved from Climate Weather Canada on Jun 5th, 2017, contains the annual temperatures of 2015 for 3 cities in Canada: Montreal, Victoria and Ottawa (downloaded as 2015_city_temp.csv files).
- The .csv files contain extra information that are not necessary in this task. Therefore, we created the script
gdd.pyto run the data from the .csv files into more readable and useful information. The output files generated contain only the days, min/max daily temperatures and the cumulative GDD (growing degree days) which are already calculated for each city. These files were named 2015_city_10_30_gdd.csv (found in the Outputs folder). The data obtained was used to create plots showing the annual cycle of min/max daily temperatures for each city and the accumulation GDD. The files obtained when using thegdd.pyscript were also used to calculate the GDD by calling the 'tbase' and 'tupper' as arguments that were set up to be 10 and 30, respectively.
gdd temperatures.csv tbase tupper
- The script
create_plots.pyis used to create all the plots in this project. Therefore, everytime that both scriptsgdd.pyandcreate_plots.pyrun, the scriptcalc_gdd.pyis used as a module/tool to calculate the GDD. The scriptcreate_plots.pyalso requires another script to run calledstation_info.py, in which has the stations IDs defined for each city. - For this task, 4 plots created are shown in 2 figures: 1) 3 plots showing the max and min temperatures for each city and 2) 1 plot showing the accumulated GDD for the three cities. Figures are found in the Outputs folder and named as CompareMaxMinTemp.png and CumulativeGDD.png, respectively.
- The functions defined are:
max_min_plot(names)
gdd_plot(names)
For all plots generated in this task, the script create_plots.py is called, except for question 5.
- Question 1: This online plot shows the average GDD for Ottawa from 1950 to 2016.
bokeh_plot_gdd_years('Ottawa',1950,2016,10,30)
- Question 2: The input .csv files to solve this question are found in the Input folder (TempMax, CanadaMean, TempMin). The map of Newfoundland shows the effective GDD of the country distributed by colours, in which as redder the area is, higher the GDD cumulation is.
make_map_plots()
- Question 3: Calculating the GDD by using different base temperatures (Tbase = from 5 to 14) for Victoria in 2015. This plot shows how the cumulative GDD changes depending on the base temperature chosen. The default for the base temperature is 10, so if Tbase is increased by 11 for example, then a higher GDD curve is seen because more temperature is accumulated along the days.
analyze_tbase('Victoria',2015,6,15,10,30)
- Questions 4: These bokeh plots show interactively the Tmax and Tmin and the cumulative GDD for Victoria in 2015.
bokeh_plot_temp('Victoria',2015)
bokeh_plot_gdd('Victoria',2015,10,30)
- Question 5: By calling the script
bokeh_serve_gdd.py, one can check the accumulated GDD for the 14 capital cities in Canada, including Montreal.
bokeh serve --show bokeh_serve_gdd.py
- Question 6: This plot shows the accumulation of GDD over a chosen period of years, in which the GDD is seen as a linear regression.
plot_lin_reg('Toronto', 1960, 2015, 10, 30)
This colored map is showing which month the Maple Tree Bloom happens in Canada.
make_map_plots()
The LaTex report generates a PDF file containing the summarized results for this project.
When running the script test_gdd.py one can test if the calculation for the GDD is working as expected (see Testing folder).
To see our presentation online, please click here.
[1]. Growing degree-days: one equation, two interpretations http://digitalcommons.unl.edu/cgi/viewcontent.cgi?article=1086&context=usdaarsfacpub
![]() Thank you.
Thank you.
