Both exporter and the template (Prometheus/Grafana) are public and they demonstrate a possibility to display basic metrics of EOS-like networks such as ( EOS, TELOS, BOS, MEETONE), thus the metrics exporter should be installed and launched for every single network. It’s also planned to expand the number of chain specific metrics, so that we can have a detailed and complete picture of each ecosystem. In this regard, public contribution is welcomed!
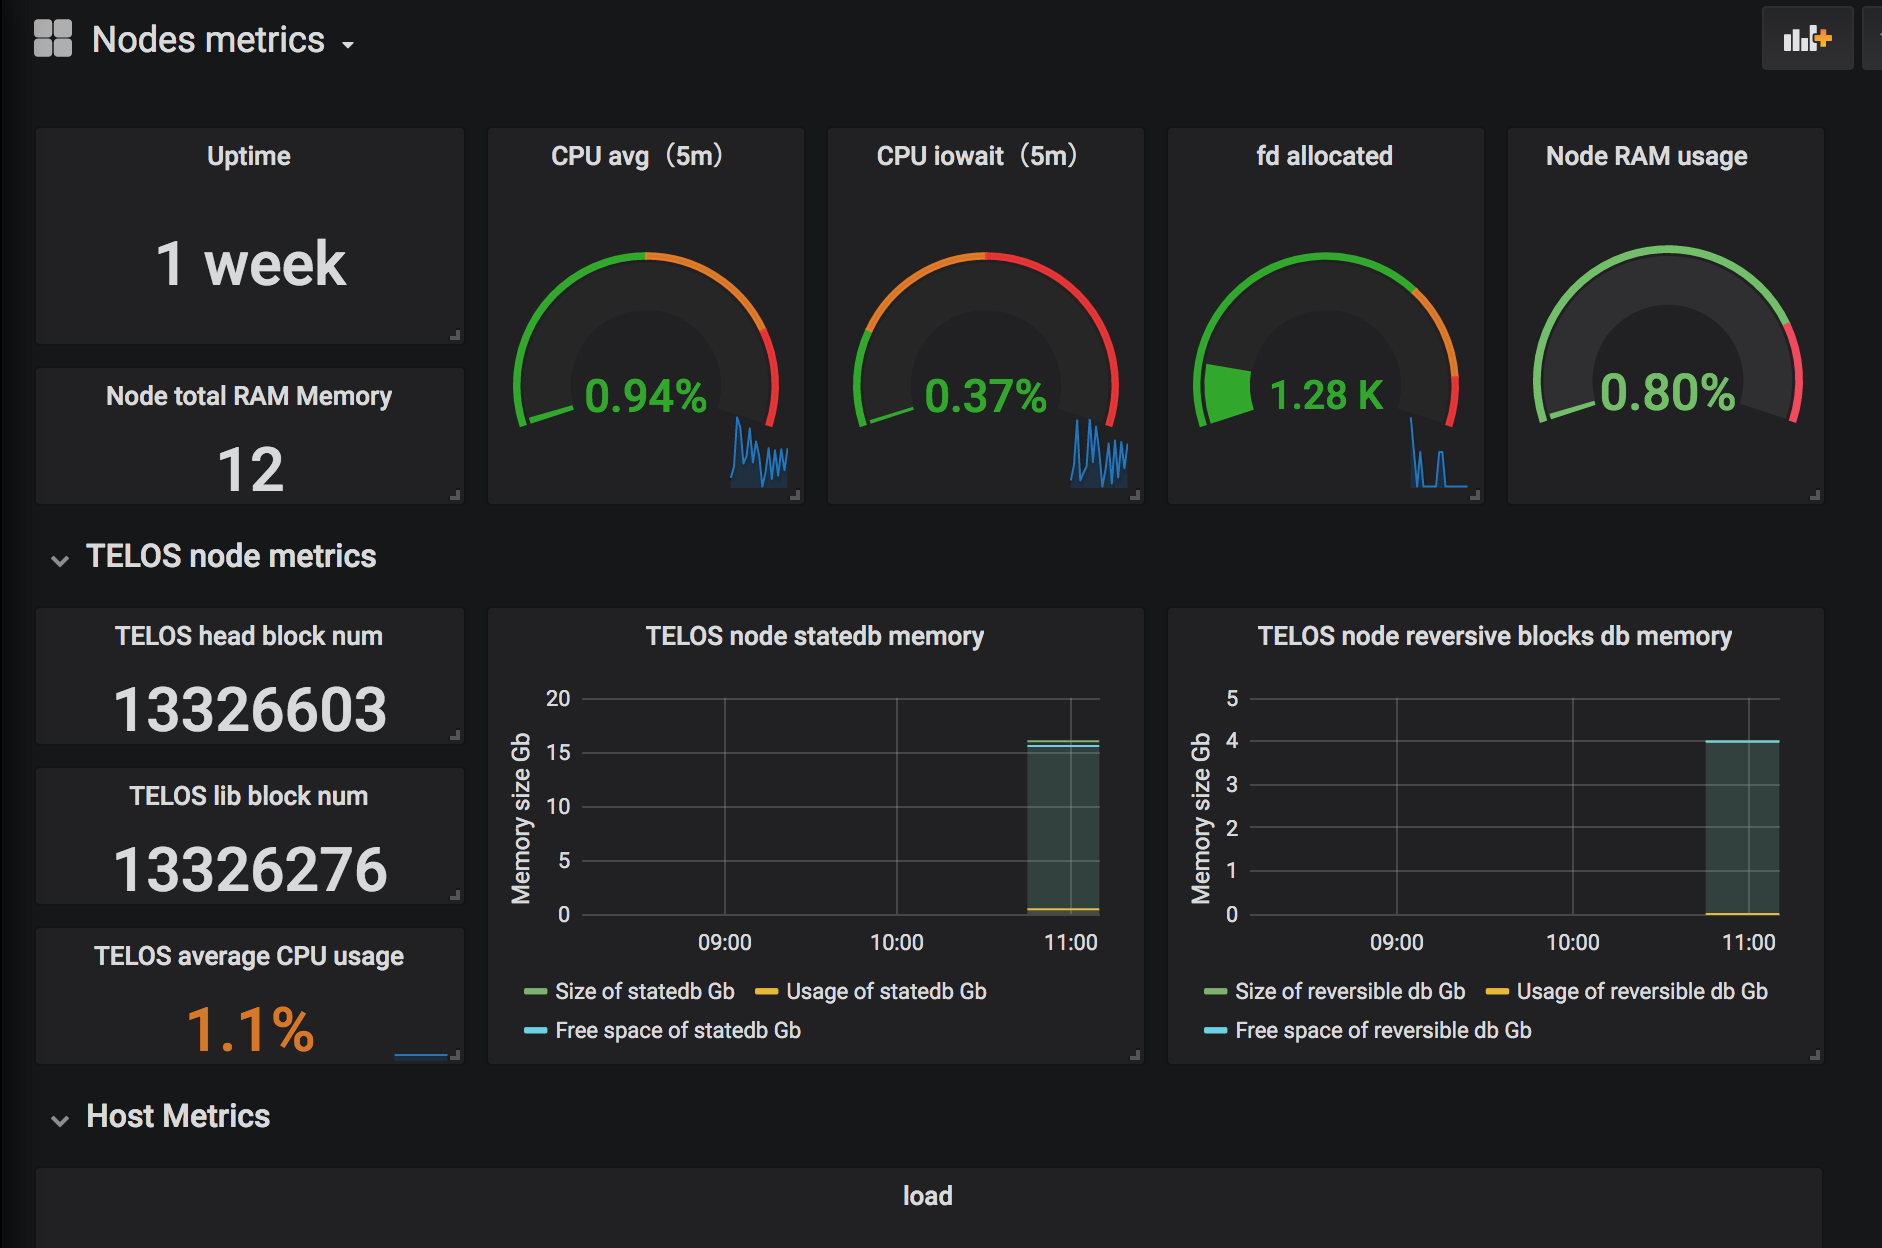
You can find an example grafana dashboard for this setup on https://grafana.com/grafana/dashboards/11070
- Node exporter
- Prometheus
- Grafana
- apt install jq
Create directory:
mkdir -p /var/lib/node_exporter/textfile_collector

chown node_exporter:node_exporter /var/lib/node_exporter/textfile_collector
Change service file:
vim /etc/systemd/system/node_exporter.service
[Unit]
Description=Node Exporter
Wants=network-online.target
After=network-online.target

[Service]
User=node_exporter
Group=node_exporter
Type=simple
ExecStart=/usr/local/bin/node_exporter --collector.textfile.directory /var/lib/node_exporter/textfile_collector

[Install]
WantedBy=multi-user.target
This script collect metrics to text file. You need to set variables in eos_exporter.sh. You can use supervisor to start this script.
To check Node Exporter use curl http://localhost:9100/metrics.
To get metrics for other cryptocurrencies you need create other scripts. For example bos_exporter.sh.
You can import template Nodes_metrics.json to Grafana using standard import procedure.