- Description
- Motivation
- Features
- A Brief Overview of Venus
- Getting Started with Venus
- Technologies
- Contributing
- License
Venus is a lightweight, self-hosted service monitoring tool that provides customizable, real-time and historical data on critical health metrics of service dependencies.
As the popularity of microservice architectures has grown, managing the complexity and keeping tabs on the health of service dependencies is increasingly critical. While many service monitoring solutions exist as a subset of heavier end-to-end solutions, Venus aims to provide a point solution that gives users a flexible, lightweight solution that enables them to monitor KPIs on all of their applications. Additionally, Venus is self-hosted and therefore users only incur costs for storage and compute.
- Real-time rolling averages on service specific KPIs including Availability, Response Time, Load, and Error Rate.
- Service specific KPI threshold settings for quick glance report cards.
- Historic panel data on KPI statistics for Past Hour, Past Day, Past Week, Past Month intervals.
- Dependency Graph visual that maps service structure and methods.
- Server side authentication for secure storage and distribution of analytics.
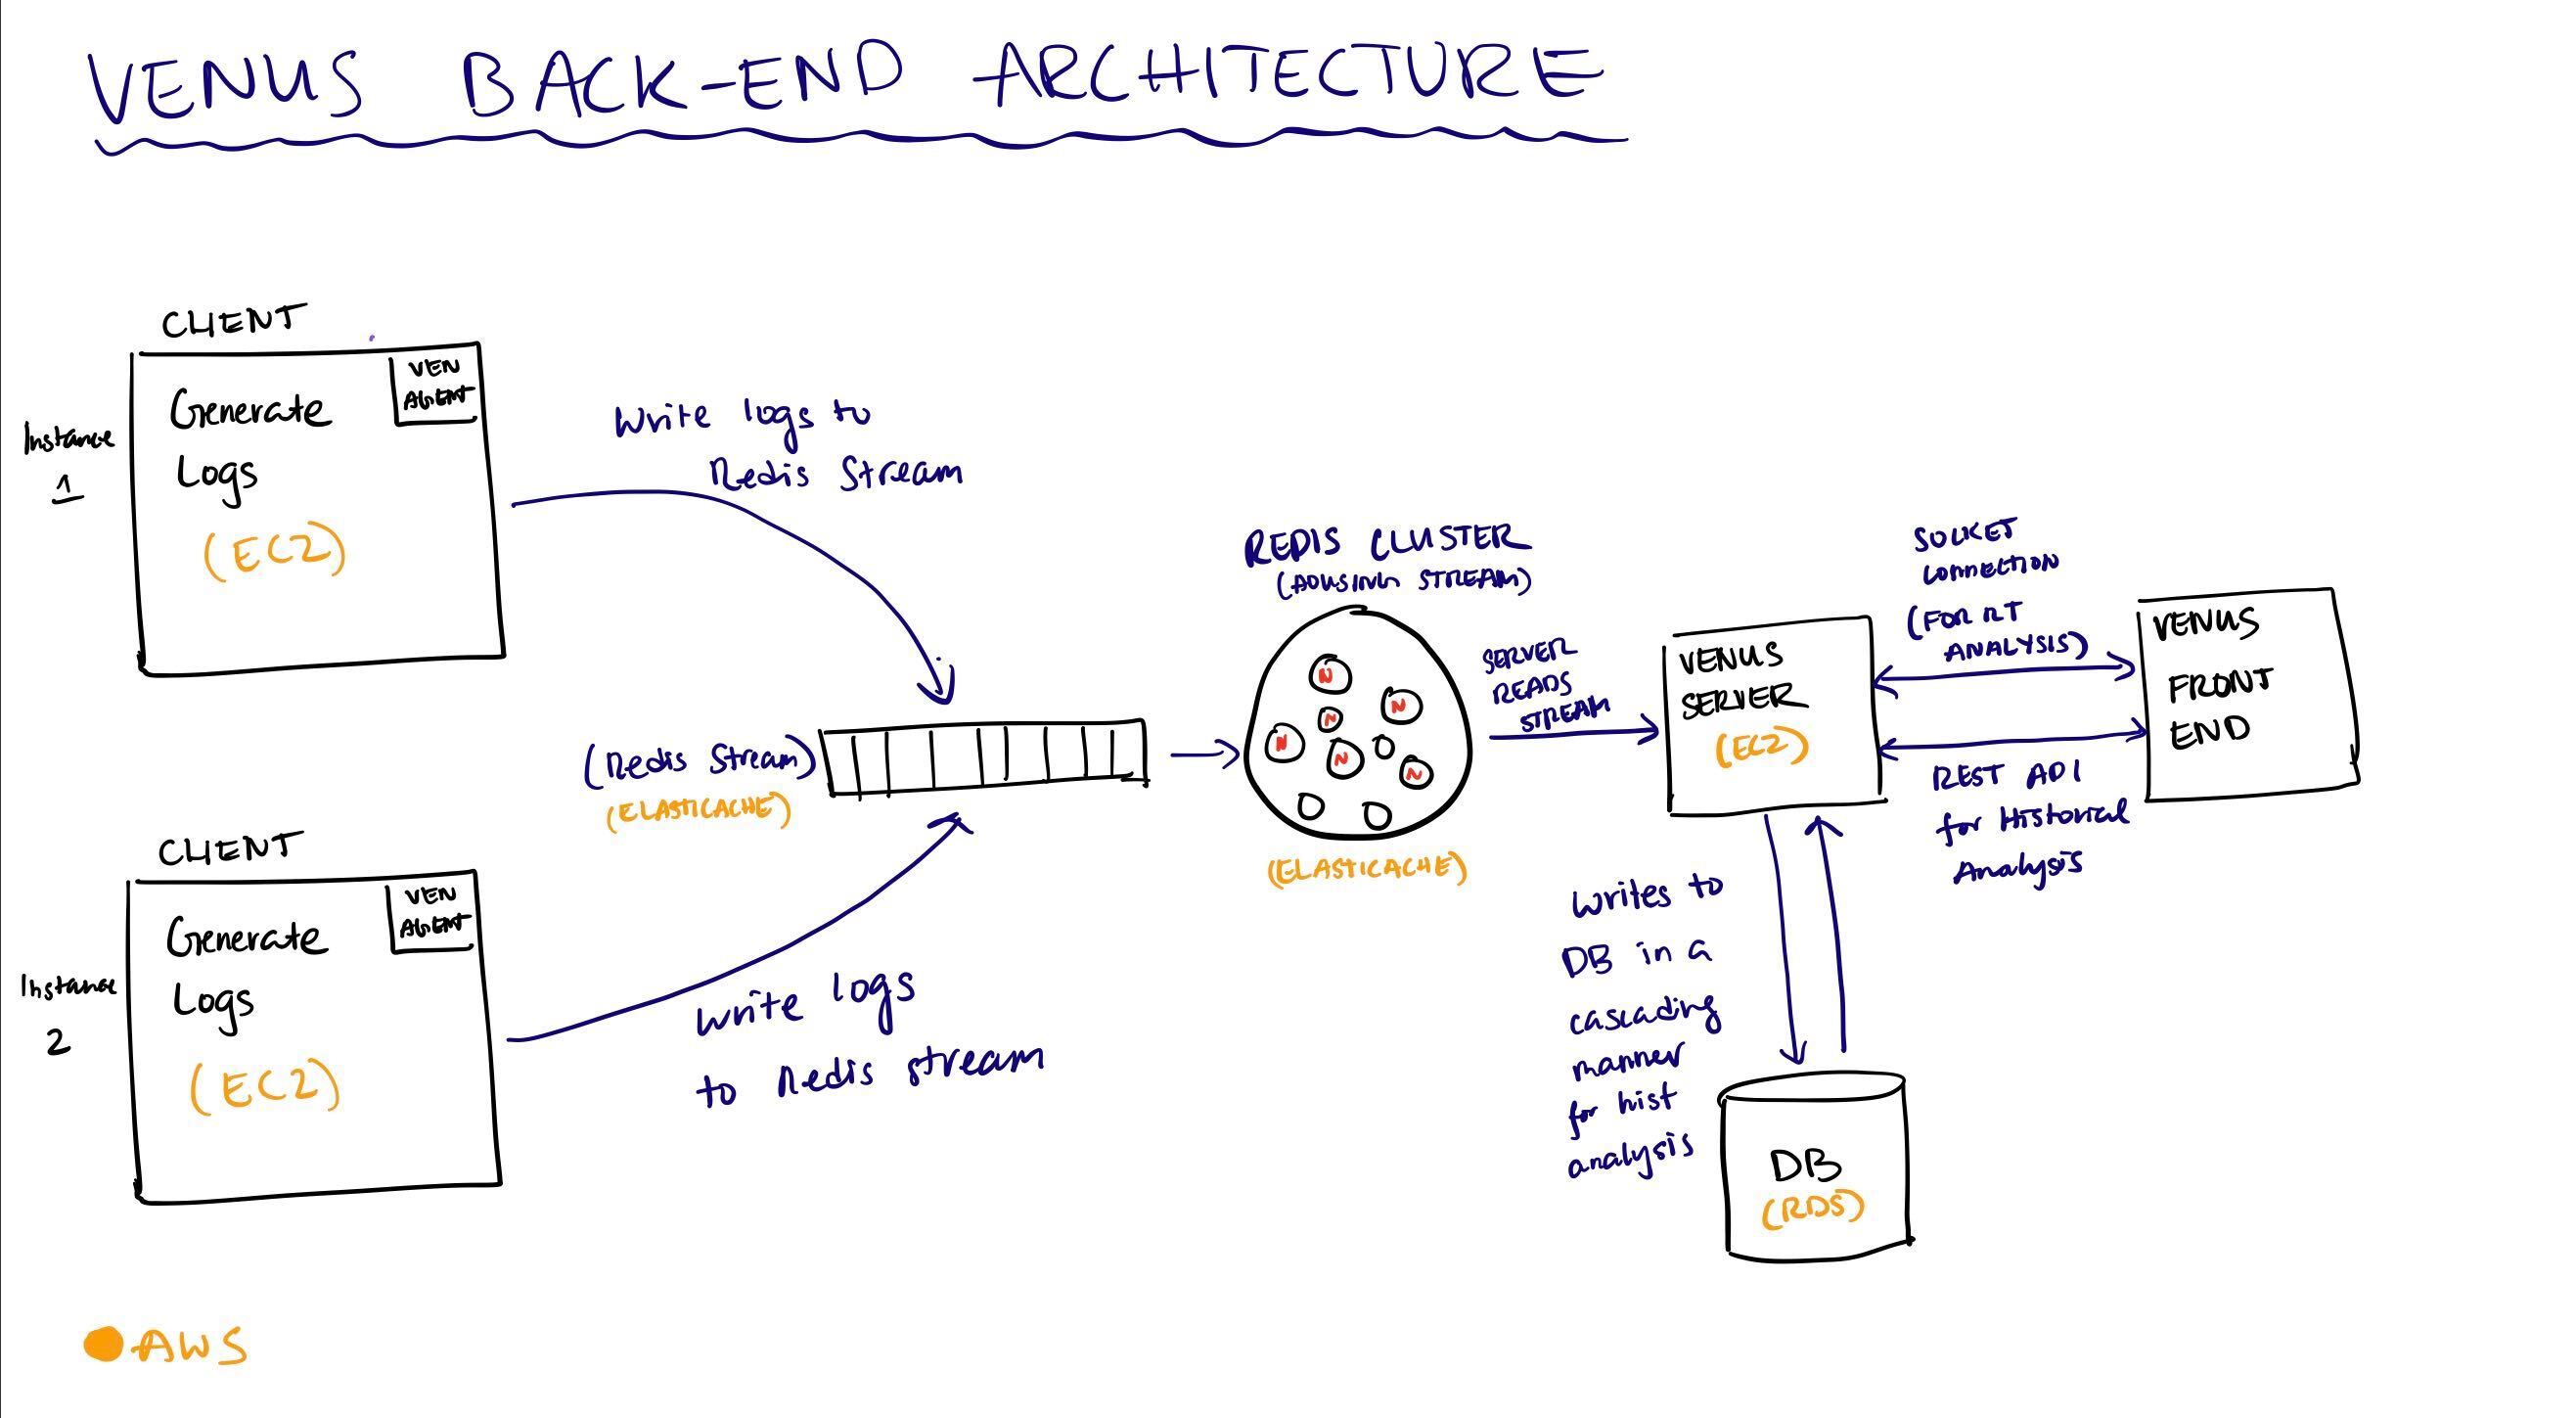
There are three key phases of The Venus Orbit:
- Collecting data:
- When deploying instances of an app, users will require in a Node.js wrapper that intercepts and logs all HTTP/HTTPS requests and responses to external service dependencies. Each wrapper is configured to write these logs to a read/write stream configured on a Redis cluster. The Redis cluster serves as a secure temporary storage for the raw log data, following LRU caching protocols.
- Analyzing data:
- The Redis Cluster stream is then read from the Venus server and at a specified interval, the server reads from the stream and pipes the data to a Danfo.js based module for analysis. After analysis, the data is sent via websocket to the GUI for visualization.
- For historical data, the Venus server pipes the data from the Redis stream at a specified cadence and is then processed, analyzed and stored in a series of cascading data tables ready to be served. Panel data flows to the frontend interface via a RESTful API.
- Viewing data:
- To view the data, users must launch a local version of the Venus Electron GUI. Upon load, users will be prompted to enter the full server address of their server instance. Upon render, the websocket handshake is established with Venus server instance and both real-time and historic data is automatically fetched and rendered.
- Service specific analytics will populate the dashboard and will continue to give users updates on their server until they end their session by navigating to the Sign Out tab. A successful sign out wipes all session data and returns users to the Venus login page.
Return to Top
git clone https://github.com/oslabs-beta/venus.git
within the parent directory of Venus download the dependencies.
npm install
run
npm run dev:react
then in a second concurrent terminal run
npm run dev:electron
Development of Venus is open source on GitHub through the tech accelerator umbrella OS Labs, and we are grateful to the community for contributing bugfixes and improvements. Read below to learn how you can take part in improving Venus.
- The addition of Metrics for dynamic and historic data.
- Webhook integration for user alerts on threshold triggers.
- DB storage for user thresholds.
- Akshay Suggula asuggula
- Oliver Roldan oproldan1
- Will Kencel wkencel
- Vlad Munteanu vxm5091
- Evan Perlman evperlman
Sanjay Lavingia, Shyam Venkataraman, Kesav Mulakaluri, Santosh Mohan, Mike Soennichsen, Julie Wu, Will Bladon, Justin Cohen and Nick de los Santos Jr. for their thoughtful feedback and guidance.
#MIT


