Memory Leaks
Utilities to assist you finding processes that are leaking memory on a running system
There are two operations that are needed to find a memory leak:
- Sampling the memory usage of all processes
- Plotting the data
The sample rate can be adjusted to suit your needs. For example, if you are looking for a leak that happens over a long period of time, you can set the sample rate to 30 minutes, or even daily. If you are looking for a leak that happens quickly, you can set the sample rate to 5 seconds.
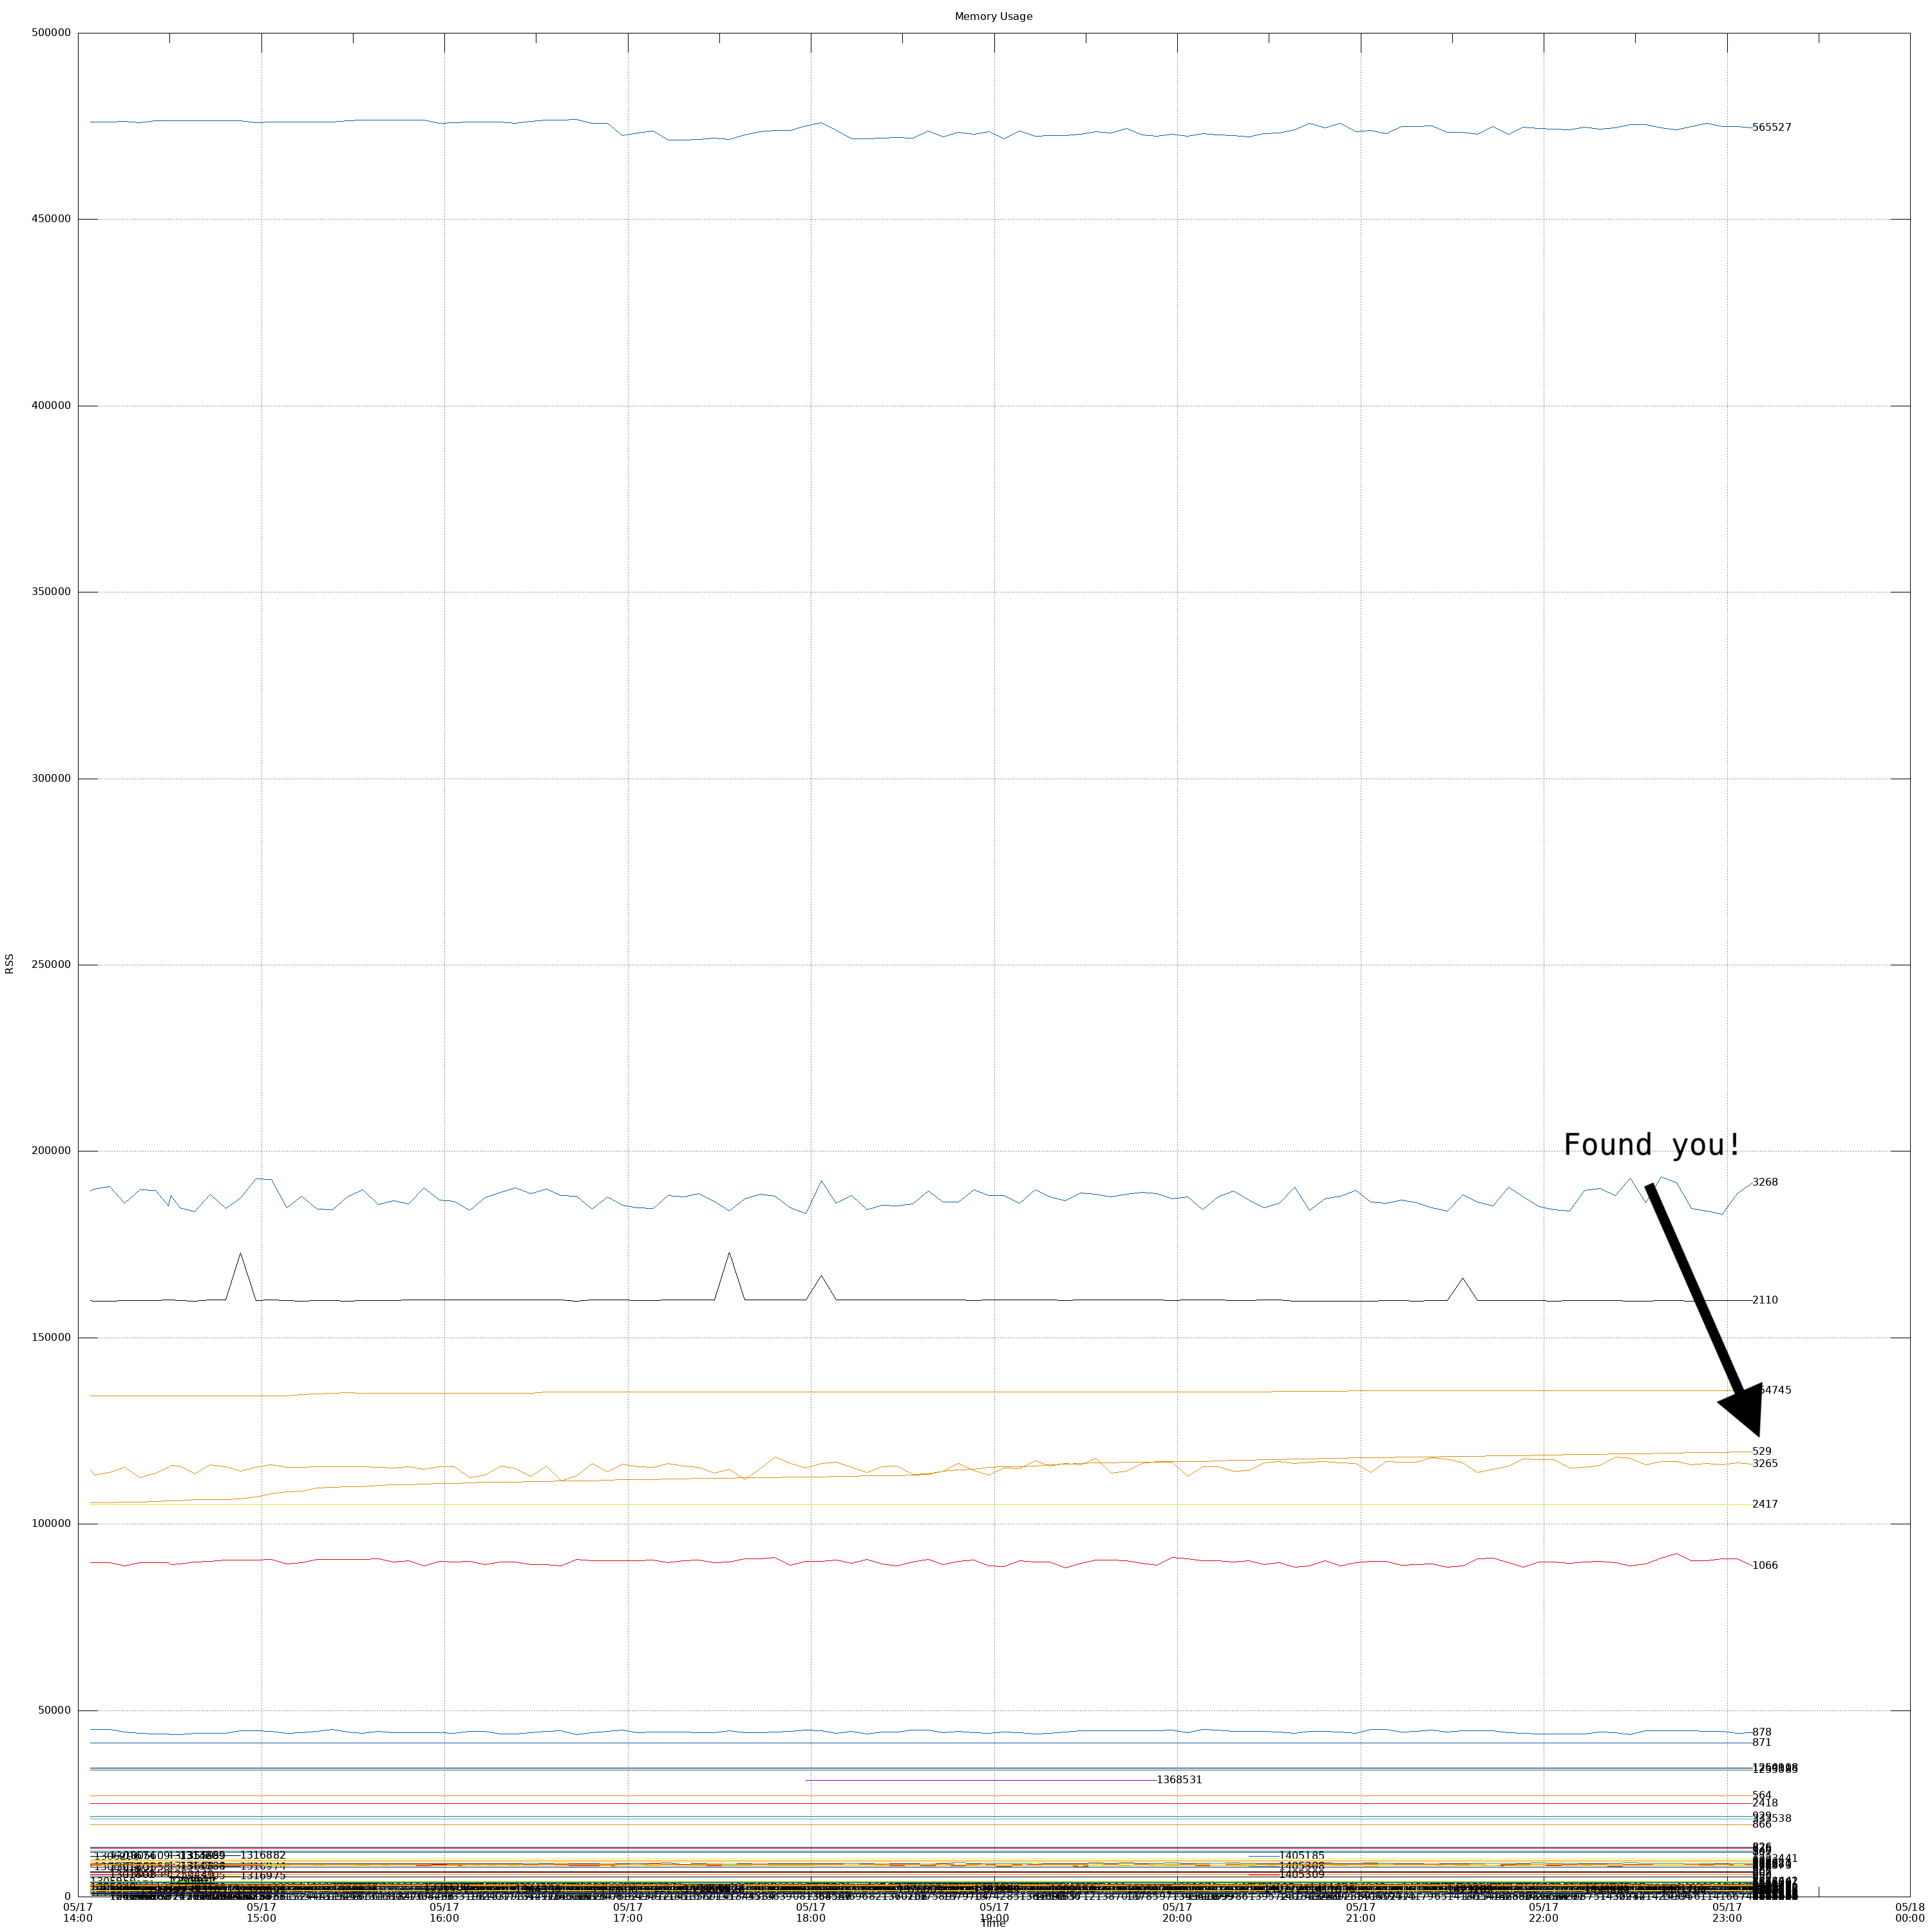
Here is a preview of the graph generated.
Usage
You can investigate a process running on your local machine, or deploy the script to a remote machine in a screen session.
Local usage
# Start collecting data
just start
# In a separate terminal, you can plot it at any time
just plot
# After you are done, stop the data collection
# And don't forget to clean up after yourself
just cleanRemote usage
export host=host_name_or_ip_address

 # Start collecting data
just remote-start ${host}

# At anytime pull the data
just remote-download ${host}

# ... and plot it
just plot

# Stop collecting data
just remote-stop ${host}

# Keep your sysadmin happy :)
just remote-clean ${host}

# If you want to peek at the daemons output
just remote-peek ${host}
Stopping and starting the data collection
So long as you don't delete the data directory on the remote host, you can stop and start the data collection at any time.
Data directory
If your host is crashing and clearing the /tmp directory, you can change the data directory by setting the data_dir variable in the remote-start recipe.
export HOST=host_name_or_ip_address

just remote-start ${HOST} data_dir=/var/tmp
Requirements
If there is any problem with the scripts, please check the versions of the tools you are using.
bash --version | grep 'GNU bash'
awk --version | grep 'GNU Awk'
gnuplot --version
just --version
At the time of writing these scripts these were the versions of the tools installed locally:
GNU bash, version 5.2.15(1)-release (aarch64-apple-darwin22.4.0)
GNU Awk 5.2.1, API 3.2
gnuplot 5.4 patchlevel 6
just 1.13.0
For you convenience, you can get these exact versions using the nix flake.
$ nix develop

mem-leak-helpers $ just
Available recipes:
    start sample_rate="5" # Run the memory usage collection script (locally)
    clean                 # Purge files used for local collection
    plot                  # Plot the data and open the graph
    bin-versions          # Version of binaries installed locally
    remote-start host sample_rate="5" data_dir="/tmp/mem_usage" # Start a remote daemon to collect memory usage
    remote-peek host      # Peek at the output of the daemon
    remote-stop host      # Stop the remote daemon
    remote-download host  # Download the data from the remote host
    remote-clean host     # Purge any files used during the collection
    remote-bins-required  # List of all the binaries required for remote collection

mem-leak-helpers $ just bin-versions
GNU bash, version 5.2.15(1)-release (aarch64-apple-darwin22.4.0)
GNU Awk 5.2.1, API 3.2
gnuplot 5.4 patchlevel 6
just 1.13.0
On the remote host, the following tools are required:
bash
cat
date
echo
getopts
grep
mkdir
ps
read
rm
sample
screen
sleep
tar
true
