PyCharm Professional offers a remote debugging feature that makes it possible to connect a run that executes in AML Compute with PyCharm running locally.
To do this, we need to:
- Make minor tweaks to our training script to run
pydevd_pycharm.settrace() - Create a 'Debug Submission' script - that will submit our code to AML Compute
- Configure the PyCharm Run/Debug Configuration
- Ensure that the AML Compute cluster has network connection to our local PC
- In this example, we'll be using ngrok - a service creating a secure URL that connects to your localhost
In order to start the debugger during the training run, pydevd-pycharm.settrace() must be called with the IP and port
that the debug listener is running on.
Since we don't want to change the training script between debug runs and non-debug runs, we'll put this in an if statement
that checks for the presence of an environment variable to specify debugging.
The training script in this repo is a very simple example based on the train-on-amlcompute example from the Azure Machine Learning Notebooks GitHub repo.
The debug submission script will set the required pip packages, set the environment variables needed for the run, and submit the script to Azure Machine Learning.
The debug script uses the authentication of the az command line and also uses the details of the experiment/folder
that the folder is attached to.
To attach a folder to Azure Machine Learning Services, you can run:
az ml folder attach -w AML_WORKSPACE_NAME -e AML_EXPERIMENT_NAME -g AML_WORKSPACE_RESOURCE_GROUPThe PyCharm Run/Debug Configurations are stored in the repo, there are three different components for the Debug configuration:
- Python Script for running
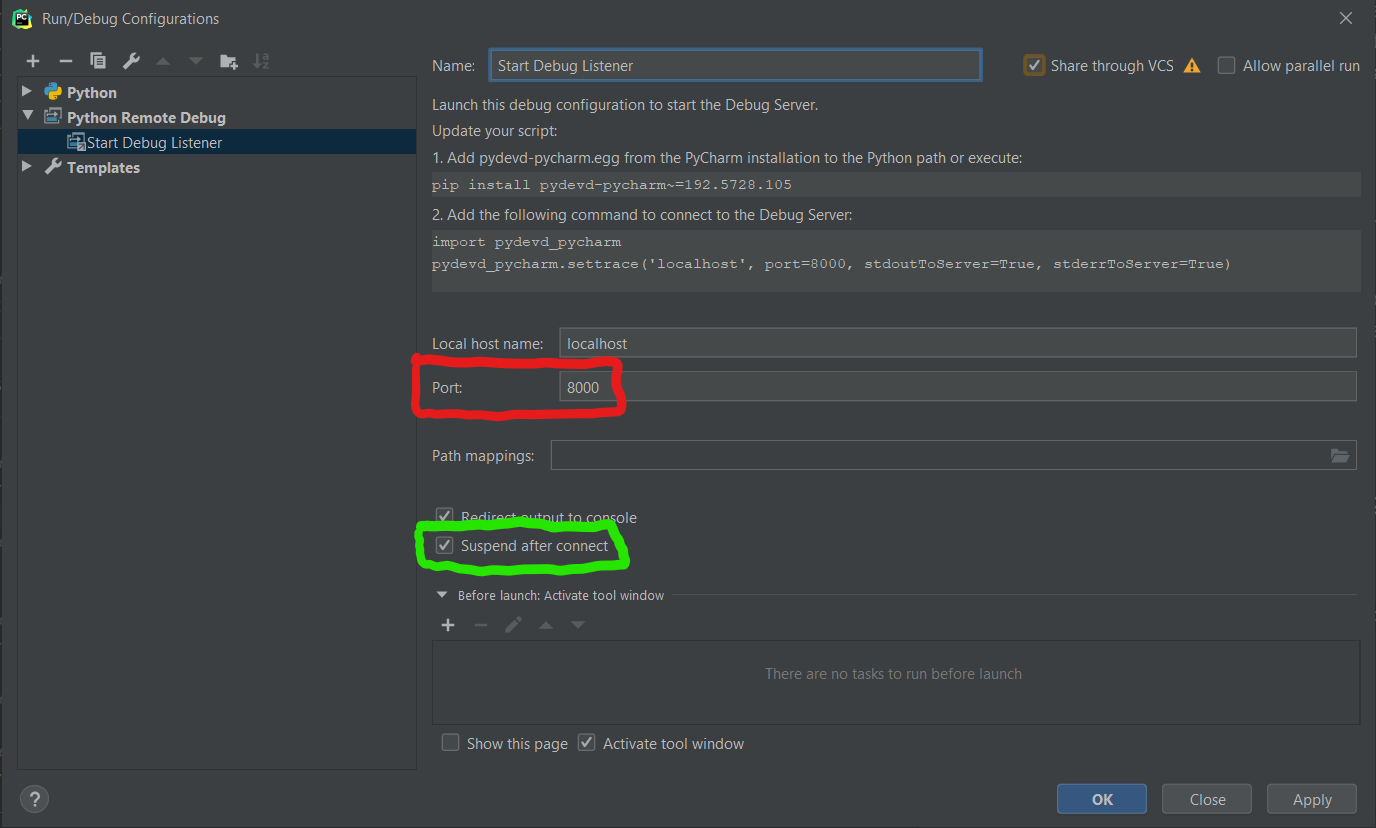
debug-submit.py - Start the remote debugger - listening on whichever port you'll set ngrok to

- Compound Run/Debug Configuration that executes the first two run configs at the same time.
The ngrok tunnel is started by running ngrok tcp 8000 (if using port 8000 in the PyCharm Run/Debug configuration -
see the red box in the image above.)
Select the 'Compound' debug config you created above click Debug (or press Shift+F9)
You can see a walkthrough of these steps in this YouTube video.
