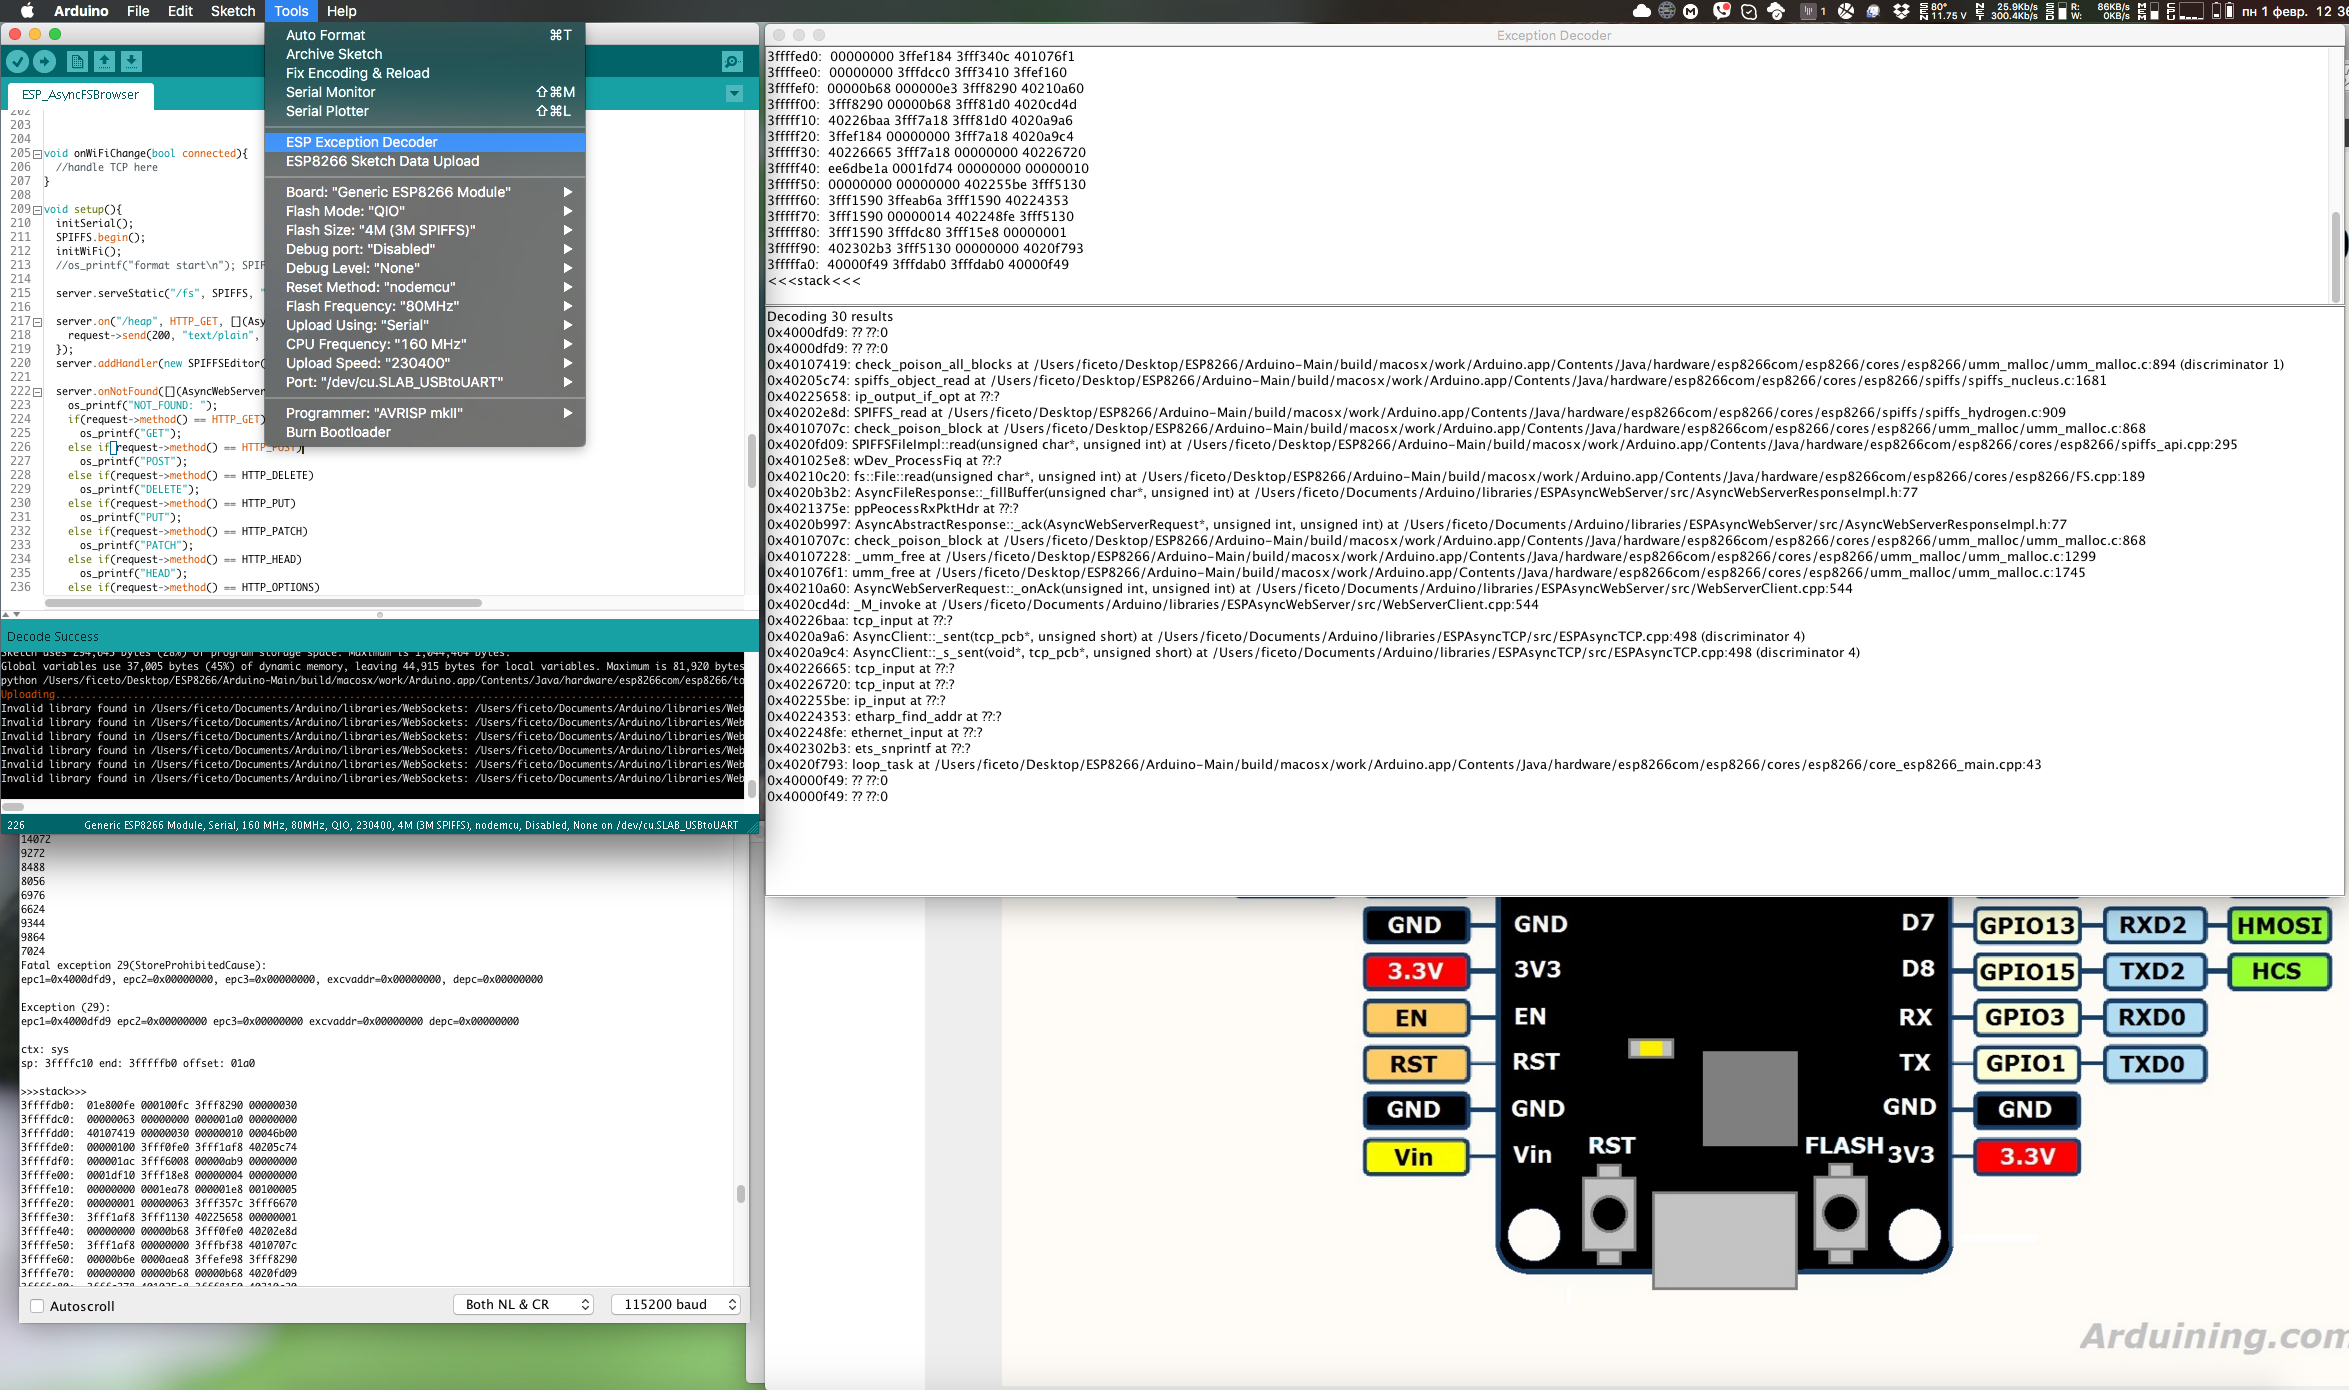
Arduino plugin which lets you get a more meaningful explanation of the stack traces you get on ESP8266 or ESP32.
- Make sure you use one of the supported versions of Arduino IDE and have ESP8266 or ESP31B core installed.
- Download the tool archive from releases page.
- In your Arduino sketchbook directory, create tools directory if it doesn't exist yet.
- Unpack the tool into tools directory (the path will look like
<home_dir>/Arduino/tools/EspExceptionDecoder/tool/EspExceptionDecoder.jar). - Restart Arduino IDE.
- Open a sketch and build it.
- Upload the sketch and monitor the Serial port for Exceptions
- When you get an Exception, open Tools > ESP Exception Decoder menu item. This will open a new window.
- Paste the stack trace into the window's top pane and the result will show in the bottom.
- Every time you enter new address or stack trace, the results will refresh
- Copyright (c) 2015 Hristo Gochkov (ficeto at ficeto dot com)
- Licensed under GPL v2 (text)
