This repository facilitates the analysis of raw data in the .abf format, with a focus on studying translocating events through nanopores. It provides comprehensive signal analysis capabilities, including:
- Identification of Translocating Events: Automatic detection of events within raw data.
- Deep Analysis of Signals: Application of various smoothing techniques for detailed signal analysis.
- Clustering: Employment of k-means or hierarchical clustering to group events, determine the optimal number of clusters, and more. Future updates will introduce additional clustering methods.
- Similar Signal Retrieval: Identification of signals that share similarities within the dataset.
- ML-Based Classification: An upcoming feature for classifying signals using machine learning methodologies.
Ensure Python (version 3.8 or newer) is installed on your system. This project's dependencies can be installed via:
pip install -r requirements.txtClone this repository to begin:
git clone https://github.com/yourusername/translocating-event-analysis.git
cd translocating-event-analysisThe repository's features can be accessed as described below:
To identify translocating events, perform deep signal analysis, and generate plots, execute the following script:
bash find_events_and_plot.shThe analysis behavior can be customized by modifying the configs/event-analysis.yaml configuration file. This file contains important parameters that control various aspects of the analysis, including paths to data files, smoothing techniques parameters, and versioning for output directories. Update the configuration file according to your specific requirements before running the analysis scripts.
Example configuration parameters include:
version: Specifies the version of the analysis, affecting output directory naming.data_file_path: The path to the raw .abf data file for analysis.sampling_rate,base_sigma,gaussian_sigma, etc.: Parameters that control the data processing and analysis techniques.
The following are examples of outputs generated by the analysis scripts. Ensure the images are available in your repository or hosted online to be viewable in the README.
- Static Plot Examples:
For an interactive analysis experience, the bash script generates HTML files that can be viewed in any modern web browser. To view these interactive visualizations, download the HTML files from the following paths within the repository, and open them in your browser:
plots/dips_plots_07_0s_300s_soft/0s-300s/dip_100_start_72.254200s_end_72.261580s.htmlplots/dips_plots_07_0s_300s_soft/0s-300s/dip_112_start_80.829836s_end_80.830548s.html
Simply click on the links to navigate to the files in GitHub, then use the "Download" or "Raw" options to save them to your computer. Once downloaded, open the files with your web browser to explore the data interactively.
To find the optimal cluster size in your data:
python optimal_cluster_number.pyFor applying hierarchical and k-means clustering:
python cluster_kmeans.py
python hierarchical_cluster.py
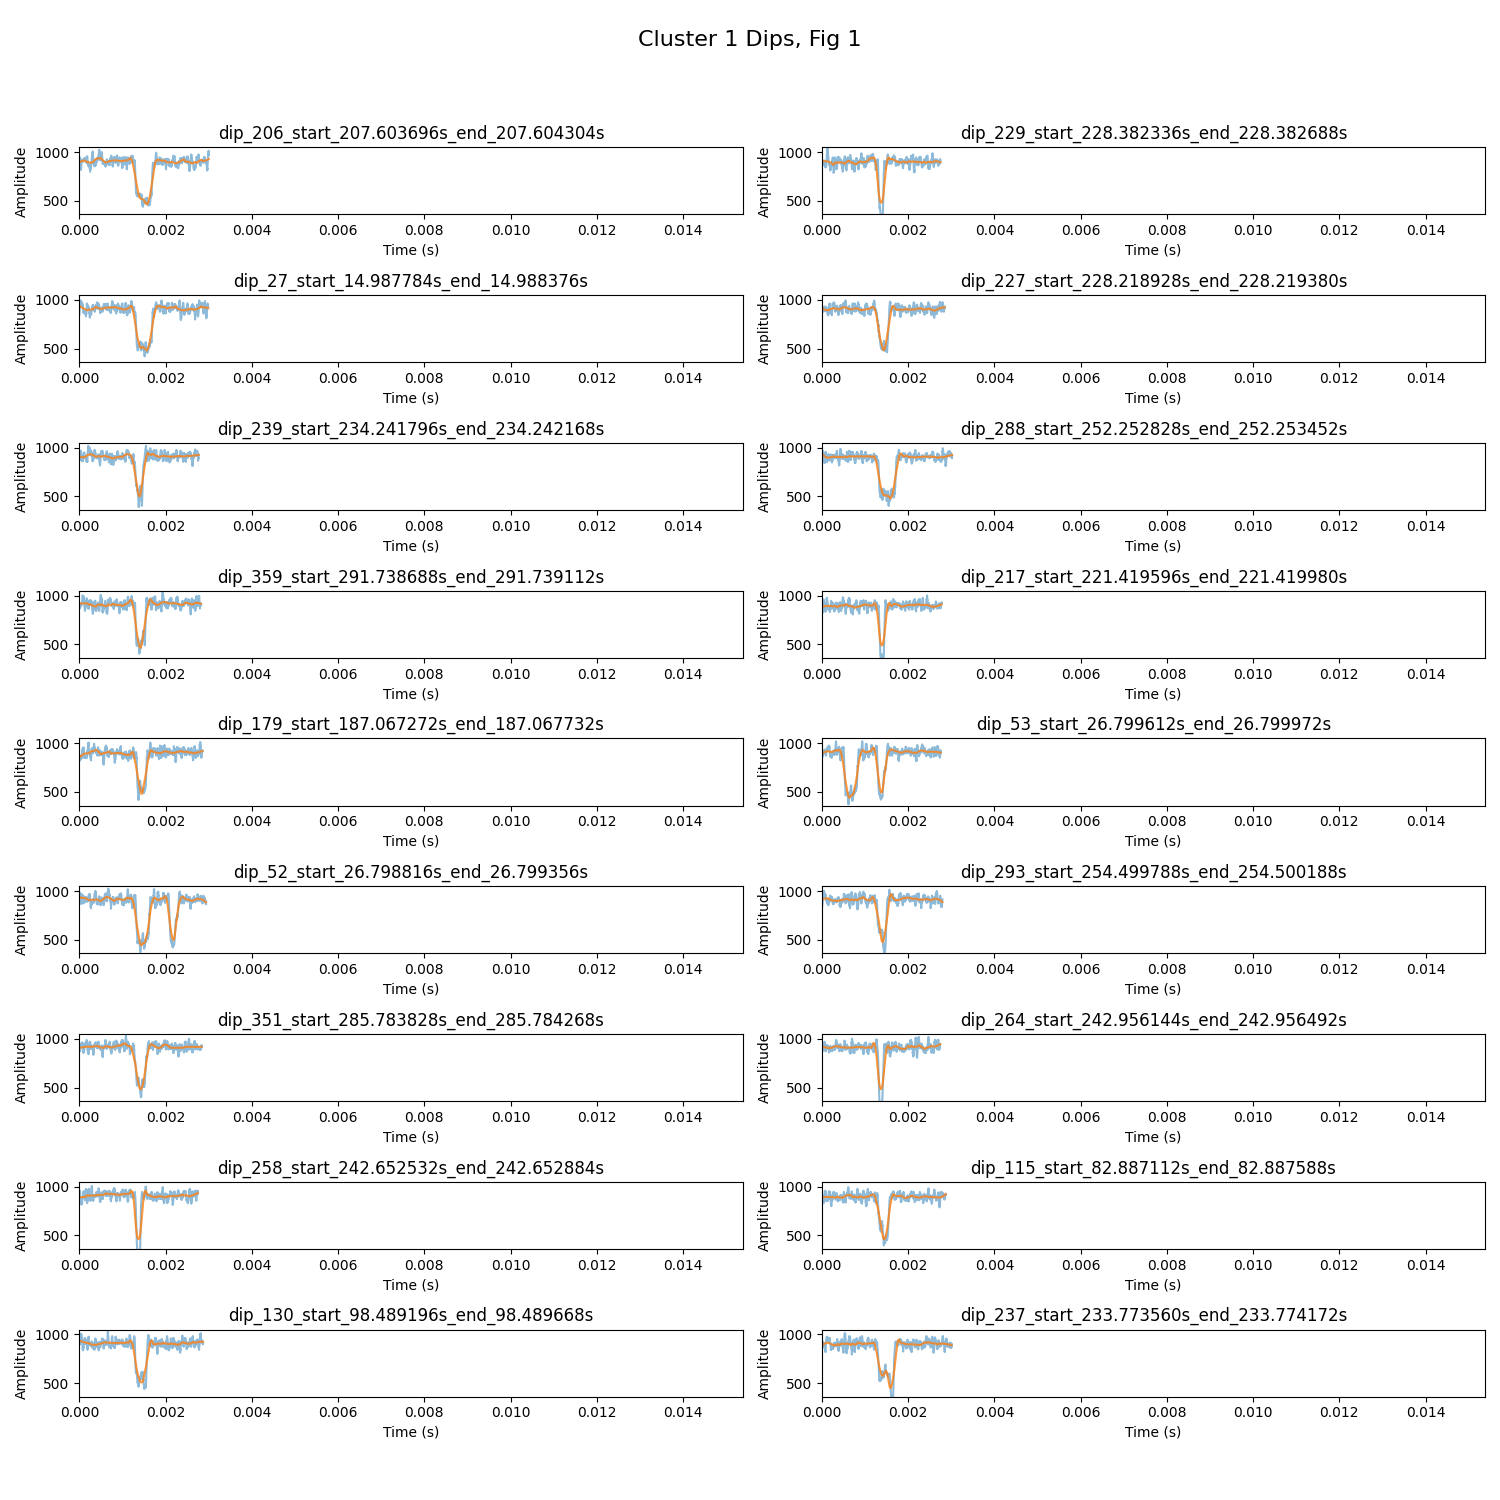
The following are examples of outputs generated by the kmeans and hierarchical cluster scripts.
The clustering behavior can be customized by modifying the configs/clustering-analysis.yaml configuration file. This file contains important parameters that control various aspects of the analysis. Update the configuration file according to your specific requirements before running the analysis scripts.
Example configuration parameters include:
feature_labels: ['Depth', 'Width', 'Area', 'Std Dev', 'Skewness', 'Kurtosis', 'Dwelling Time']: Selecting features for clusteringk: Number of cluster for KMeansmax_distance: Max distance to cut the tree on hr clustering
To find similar translocating events within the dataset run the following command:
python similar_signals.pyThe following are examples of outputs generated by the two query dip signal
To run the API for the dashboard, first ensure you have your cluster-analysis.yaml file set up with the dip directory you want to analyze. Then, you can start the API using the following command:
uvicorn api:app --reloadThis will start the FastAPI server, and you can access the dashboard by navigating to http://127.0.0.1:8000 in your web browser.
Contributions are welcome! If you have suggestions for improvements or new features, feel free to fork this repository, make your changes, and submit a pull request.


/cluster_4_fig_1.png)


