This repository holds all the codebase for the Front End server and the Back End API used in the development of the application found in http://elecciones2019.fi.uba.ar/.
All this code, as well as all the code you can find here was designed, coded and tested by a team integrated by Rodrigo De Rosa, Facundo Guerrero and Marcos Schapira in the context of the Software Engineering integral final work at the University of Buenos Aires. In this readme, the basics of this application will be explained as well as how to run it.
The point of this whole project was to analyze all the content posted on Twitter related to the Presidential elections that took place in Argentina in 2019. The main idea was to identify how similar were the conversation topics the supporters of each political party talked about and, with this, identify how similar each group was to the others.
To be able to make this analysis, it was needed to:
- Find our group of interest; this means whose tweets we would analyze.
- Determine which presidential candidate each of our users of interest supported.
- Get all the hashtags each of this users used.
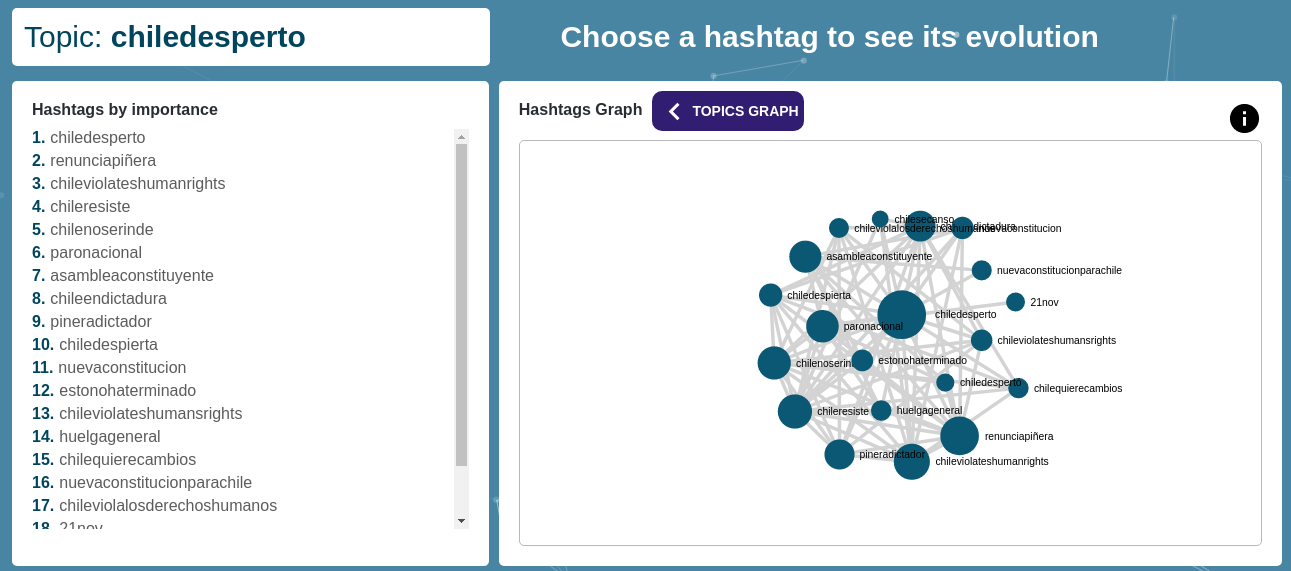
- Find topics of conversation; this would be communities of nodes in a hashtag co occurrence graph.
- Analyze how common is the use of one or another topic of conversation for one or another support group (or political party).
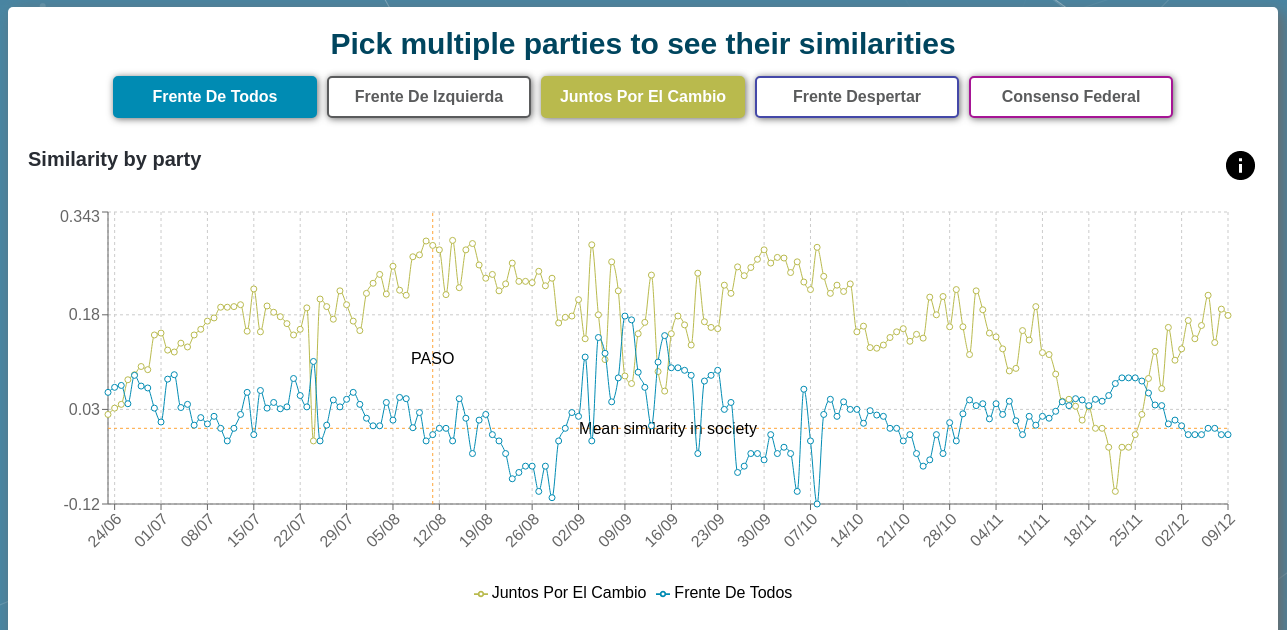
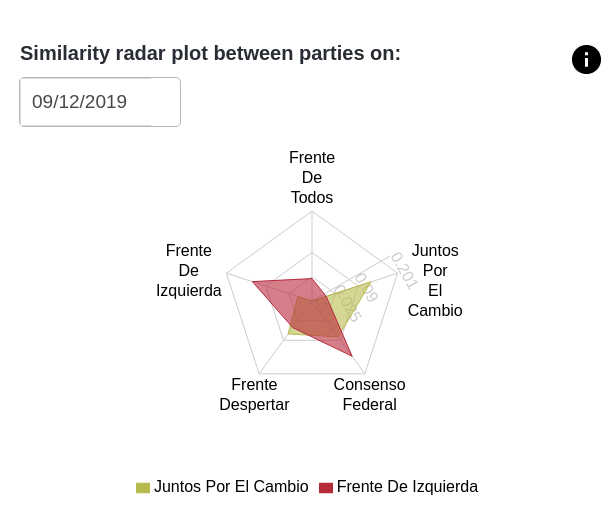
- Discover how related are the opinions of the different political parties by comparing how many conversation topics they have in common.
In this repository, you can find both the code for the Front End React application and for the Back End API server. It mainly works as a dashboard with multiple types of visualizations to help user analysis of the Argentinian presidential campaign. In the following sections, we will talk about both of them.
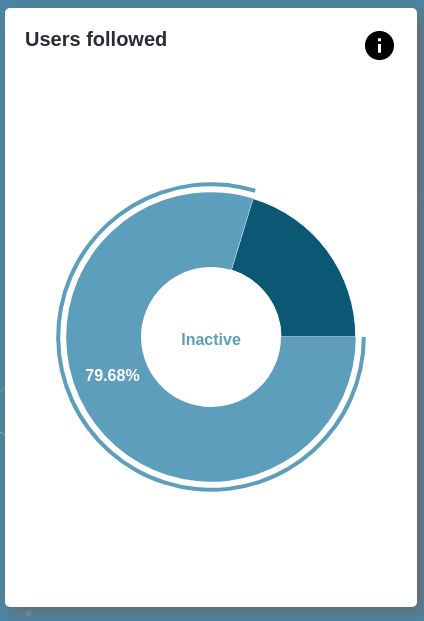
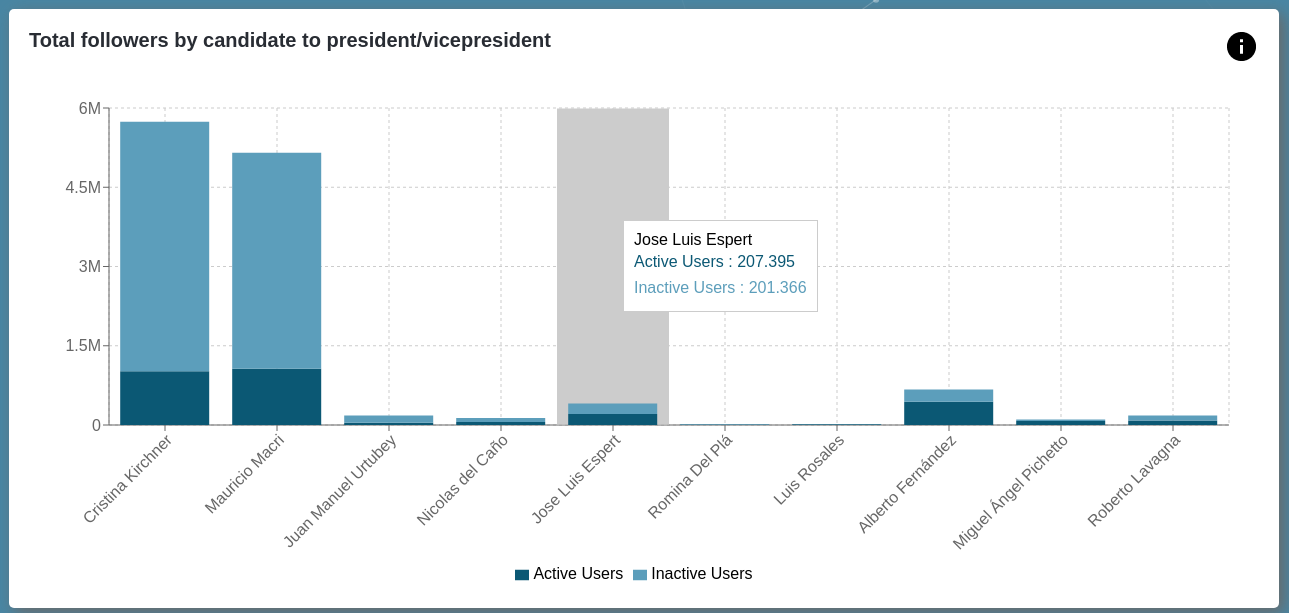
This application consumes the data generated from the Back End API and generates visualizations to help analyze qualitative and quantitative data and metrics. Al visualizations are developed as generic React components which include filters, labels and interactions. This type of approach helped as adapt to the many varied visualizations we needed and work as agile as possible. They can be adapted to any particular graphic library, in this case we used Recharts.
Each part of the analysis required particular solutions. The following sections will display some of them organized by page. The complete project can be found here.
Interactive and animated graph with layers and a secondary component to support mobile responsiveness as the graph resulted to be better appreciated in desktop view.
Interactive selection bar with randomized sort of elements for objectivity as it's a political analysis
To separate our processing application (which can be found here) from the Front End application related requests, we created a simple server that would simply get the created metrics from the database and map them to a model the Front End application could easily display.
The code for this API server is here and it is a Python Flask application running with gUnicorn for a dynamic multiple worker architecture in case we needed higher availability.
This server's endpoints were all designed to have the best possible experience while developing the Front End application; we wanted it to received exactly the information it needed for display so that we would only need to worry about how to show said data.
These endpoints were:
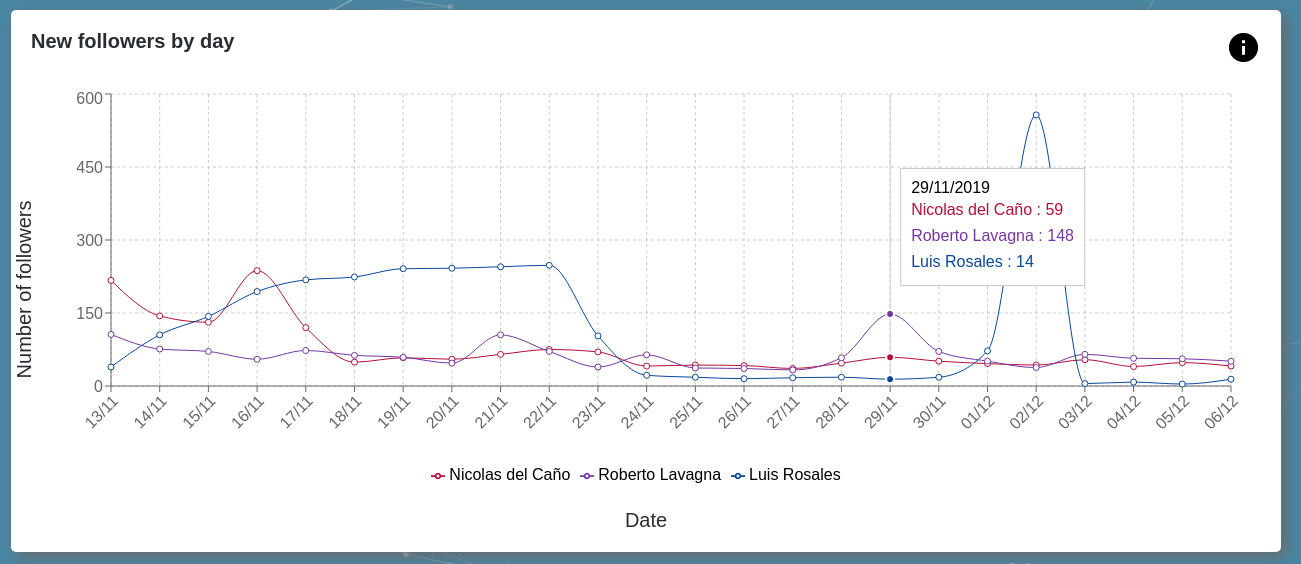
/candidatesreturns information about how many new followers each candidate got every day since the start of our analysis./topicsreturns all the information for the display of a graph with the main topics of conversation and how they were connected to each other./topics/<topic_id>returns all the information for the display of a graph with the main hashtags of an specific conversation topic and how they were connected to each other./dashboardreturns the home dashboard numbers; this is number of processed tweets, number of users analyzed, number of hashtags found and number of conversation topics computed. Some of these values were calculated only once a day and stored in order to make this particular response faster./hashtag_usage/<hashtag_name>returns data about how many supporters of each party used an specific hashtag in a certain window of time./topic_usage/<topic_id>returns data about how many supporters of each party used at least one hashtag of an specific conversation topic in a certain window of time./similaritiesreturns a report about similarities between the different party's support groups; a concept you can find explained here./party_relationshipsreturns information about how polarized the user network is; a concept you can also find explained here./<path:path>would handle all wrong paths and return an exception.
This application was running in a server owned by the University of Buenos Aires and was deployed there using the
deploy script; there, we build and injected the static files so that the python back-end could serve them. The deployment was made manually via SCP due to university's restrictions.
In order to run the server locally, first make sure you have installed:
Python 3.6mongorunning in the port 27017gUnicorn
Once that is ready, you can start the server by running make prepare and make run in the project's root. Be careful
to check the used port, as this server was directly serving from port 80 due to university's server requirements.
