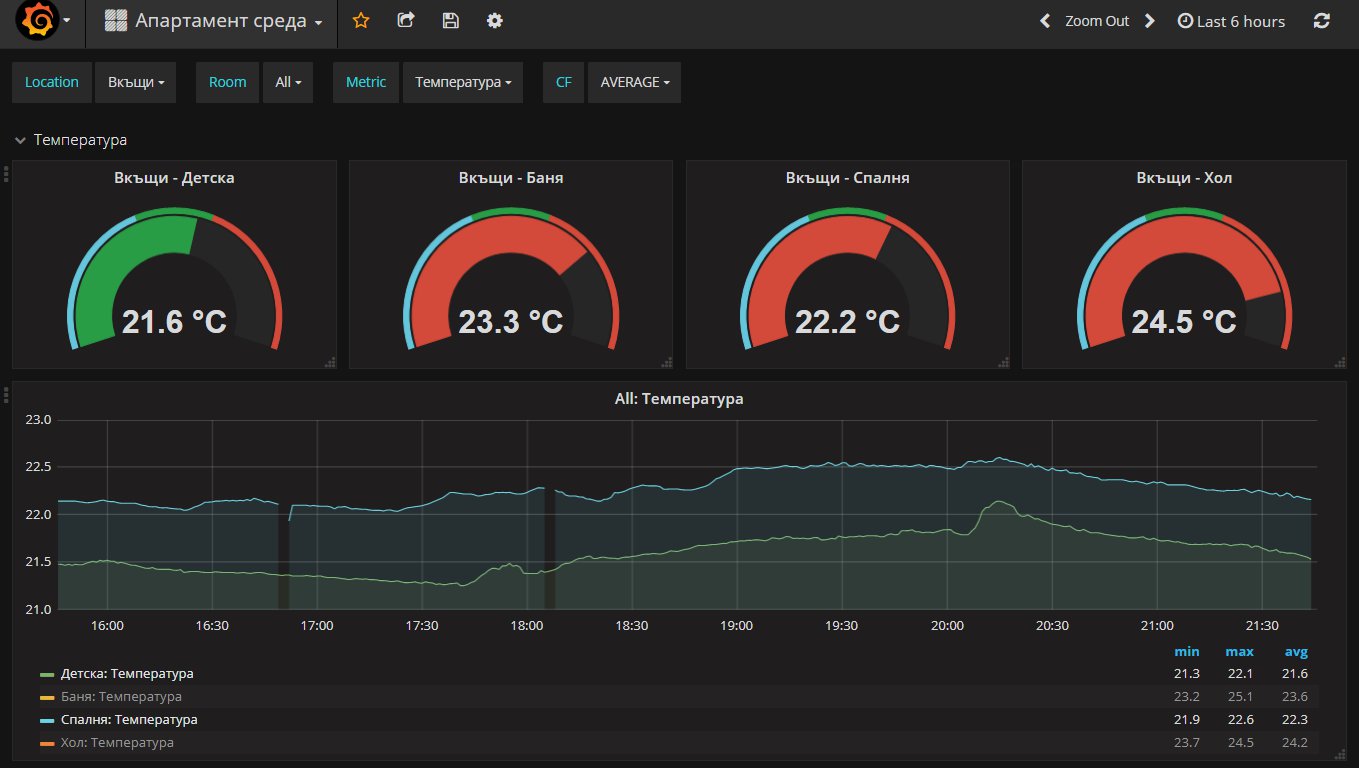
This project lets you use RRDTool files as a data source backend in your Grafana dashboards. It implements a web service that is actually an HTTP backend adapter for the Grafana SimpleJson plugin. We have the following chain of services: RRDTool data files -> rrd-json-grafana-ds HTTP backend -> SimpleJson plugin -> Grafana.
Here is a sample Grafana dashboard which gets its data entirely from RRD files:

Your web server must support PHP 5.6 or newer. Deploy the source code in your public web space:
cd /var/www/html
git clone https://github.com/famzah/rrd-json-grafana-ds.gitHere is an example for the Apache web server:
cd /var/www/html/rrd-json-grafana-ds/

chmod 700 .git # protect the GIT directory

cp .htaccess-sample .htaccess

cat >> .htaccess <<EOF

AuthType Basic
AuthName "Restricted Content"
AuthUserFile "$(pwd)/.htpasswd"
Require valid-user
EOF

NEWPASS="$(pwgen 16 1)" # if you don't have "pwgen" install, choose a password manually
htpasswd -c -i -B .htpasswd admin <<<"$NEWPASS"
echo "Your username is \"admin\" with password \"$NEWPASS\""Test that the web resource works and is password protected:
# this must fail with "401 Unauthorized"
curl https://$YOURDOMAIN/rrd-json-grafana-ds/

# supply the correct password
curl --user admin https://$YOURDOMAIN/rrd-json-grafana-ds/
The successful HTTP output by "curl" must be:
The RRDTool JSON DataSource for Grafana is ready to serve!
You need to know where your RRD data files are located. Let's assume that the root directory is "/var/lib/www-data/iot/temphumi":
$ find /var/lib/www-data/iot/temphumi
/var/lib/www-data/iot/temphumi
/var/lib/www-data/iot/temphumi/60:01:94:43:3d:13.rrd
/var/lib/www-data/iot/temphumi/60:01:94:43:3a:ef.rrd
/var/lib/www-data/iot/temphumi/2c:3a:e8:20:9b:4f.rrd
/var/lib/www-data/iot/temphumi/60:01:94:43:2f:5a.rrd
If your data is stored in multiple directories, take a look at the "multidev" plugin.
cd /var/www/html/rrd-json-grafana-ds
cp config-sample.php config.php
vi config.php
Here is a sample final configuration:
<?php
$config = [
        'namespaces' => [
                '/var/lib/www-data/iot/temphumi' => [ // where all structure-identical RRDs are stored
                        'mapping'=> [ // human-readable descriptions
                                'namespace' => 'Вкъщи', # Home Environment
                                'rrd_file' => [
                                        '60:01:94:43:3d:13.rrd' => 'Хол', # Living room
                                        '60:01:94:43:3a:ef.rrd' => 'Спалня', # Bedroom
                                        '2c:3a:e8:20:9b:4f.rrd' => 'Детска', # Kids' room
                                        '60:01:94:43:2f:5a.rrd' => 'Баня', # Bathroom
                                ],
                                'metric' => [
                                        'humi' => 'Влажност', # Humidity
                                        'temp' => 'Температура', # Temperature
                                ],
                        ],
                ],
        ],
        'max_results_per_query' => 10,
        'plugins' => [
                'core'
        ],
];
In this example, each RRD file has two metrics - temperature (named "temp"), and humidity (named "humi"):
# rrdinfo /var/lib/www-data/iot/temphumi/60:01:94:43:3d:13.rrd|grep type
ds[temp].type = "GAUGE"
ds[humi].type = "GAUGE"You can ask for all available metrics manually:
curl --data '{"target": ""}' --user admin https://$YOURDOMAIN/rrd-json-grafana-ds/searchThis must return a JSON-encoded list of metrics. In case of a problem, please review the error log of your web server and the PHP error log.
From the main menu choose "Plugins", and then click the tab "Data sources". Find the "SimpleJson" plugin and install it.
From the main menu choose "Data Sources", and then click the green button "+ Add data source". Enter the following in the "Config" section:
- Name: RRD
- Type: SimpleJson
- HTTP settings
- URL: https://$YOURDOMAIN/rrd-json-grafana-ds/
- Access: direct
- HTTP Auth
- Basic Auth: checked
- Basic Auth Details
- User: admin
- Password: $NEWPASS
You need to replace $YOURDOMAIN and $NEWPASS with the actual values.
When you finalize by clinking "Add", Grafana will test the connection to the data source and will indicate whether it's configured properly.
Create a new Dashboard and add a Graph in the first row. Click "Panel Title" of the newly created graph and then choose "Edit". In the "Metrics" tab, do the following:
- Data Source: select "RRD"
- In the first data row below, select:
- "timeserie" for the first dropdown (this is the default)
- for the second dropdown (named "select metric") choose the metric tha you want to visualize in the graph
- If you want to add more metrics to the same graph, click the button "Add Query" and configure in the same way
The RRD backend supports a regular expression based filtering language. You can filter at four different levels:
- Namespace.
- RRD file.
- Metric.
- Consolidation function (one of the following, if they were defined in your RRD files: AVERAGE, MIN, MAX, LAST).
You can query for all levels, for example:
[$Namespace]->[$RRDFile]->[$Metric]->[$CF]
You need to replace $Namespace, $RRDFile, $Metric, and $CF with a value. For example:
[Home Environment]->[Bedroom|Bathroom]->[Temperature]->[AVERAGE]
The above example means: From the namespace "Home Environment", get me the "Temperature" for rooms "Bedroom" and "Bathroom" consolidated by "AVERAGE". If you wanted to draw both the temperature and humidity, you can use a regular expression which means "all":
[Home Environment]->[Bedroom|Bathroom]->[.*]->[AVERAGE]
ℹ️ This grammar can be used directly in the "Metrics" tab of a Graph.
Or if you want to get all available metrics and all their consolidation functions, you can query just the fist two levels:
[$Namespace]->[$RRDFile]
This is useful for the Templating feature in Grafana. Read on for an examlpe about it.
Grafana Templating is a great way to get more interactive filtering of your data, and to reuse your Dashboard and Graphs for different data sources which get populated dynamically.
In your newly created Dashboard, click the Setting cog icon and choose "Templating" from the menu. Then add a few new variables. In our example, we are monitoring the temperature and humidity of a few rooms, so we will customize the names of the variables to reflect this setup.
Add a variable:
- Name: Location
- Type: Query
- Data source: RRD
- Refresh: On Dashboard Load
- Query:
[.*]
Add a second variable which uses the previous variable, too (note that this allows multi-values select):
- Name: Room
- Type: Query
- Data source: RRD
- Refresh: On Dashboard Load
- Query:
[$Location]->[.*] - Multi-value: checked
- Include All option: checked
Add a another variable which uses the previous variables, too:
- Name: Metric
- Type: Query
- Data source: RRD
- Refresh: On Dashboard Load
- Query:
[$Location]->[$Room]->[.*]
Add a another variable which uses the previous variables, too (note that this allows multi-values select):
- Name: CF
- Type: Query
- Data source: RRD
- Refresh: On Dashboard Load
- Query:
[$Location]->[$Room]->[$Metric]->[.*] - Multi-value: checked
- Include All option: checked
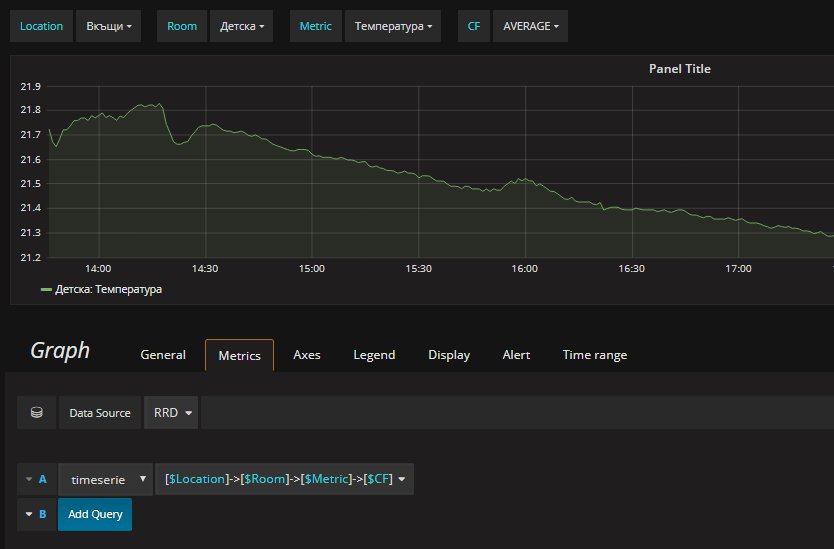
You are done with the Templating variables. This should give you a dynamic way to filter your data interactively:

Get back to the Graph at the Dashboard and "Edit" it. In the "Metrics" tab delete all metrics and leave only one. Enter the following in the second drop down:
[$Location]->[$Room]->[$Metric]->[$CF]
This instructs Grafana to display only what you selected for the Templating variables at the top of the Dashboard:

Once you've mastered Templating with RRD, you can customize your Dashboard even further. For example, you can dynamically change the title of the Graph by including the $Room name, or you can automatically draw multiple graphs if you selected multiple rooms.