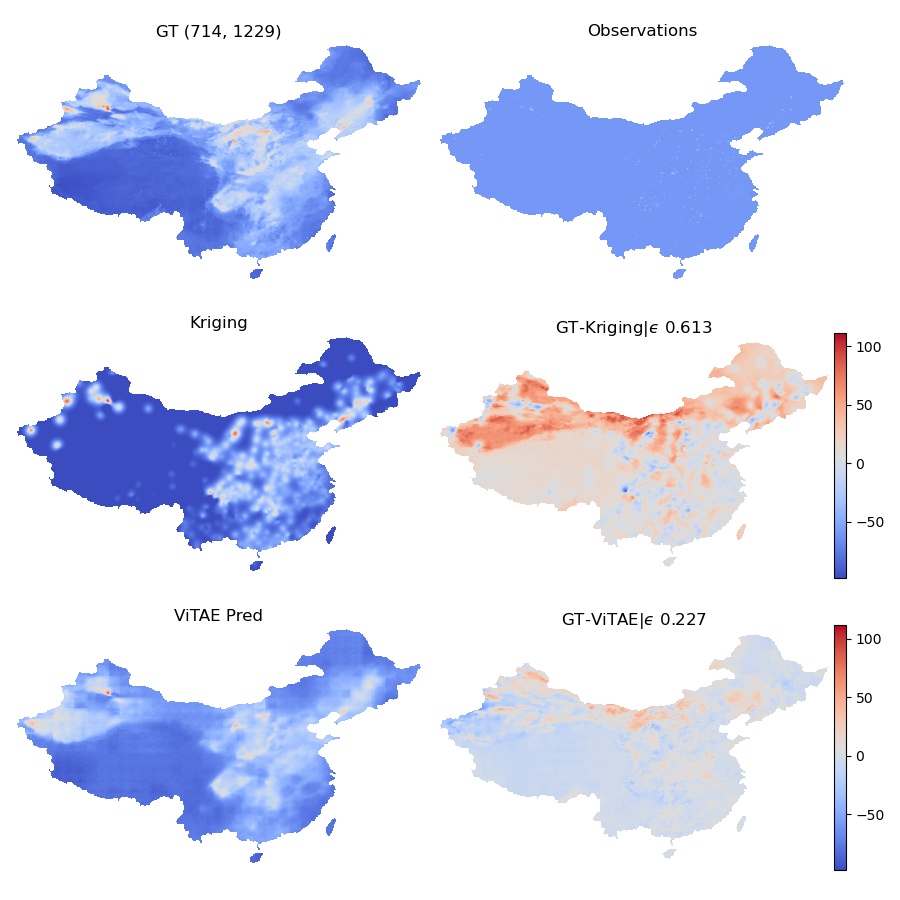
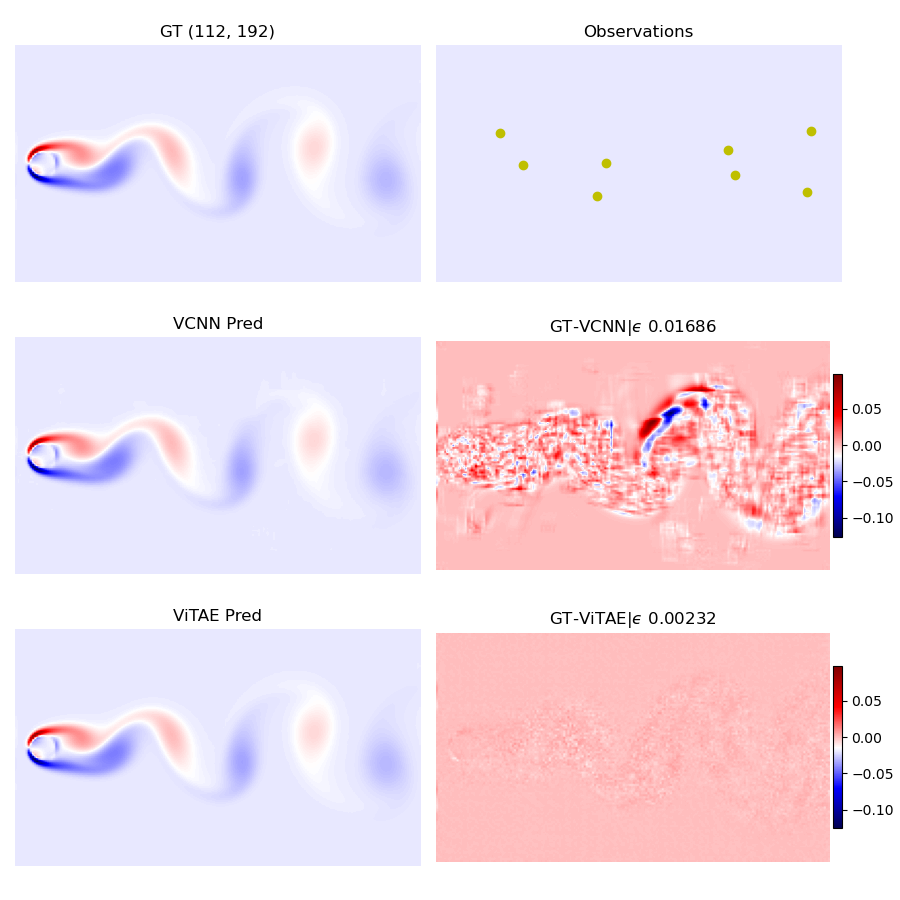
- We propose a novel vision-transformer-based autoencoder (ViTAE) for field reconstruction with time-varying, sparse, and unstructured observation data.
- Unlike traditional Gaussian process approaches (e.g., Kriging), no prior knowledge, such as covariance kernel and correlation length, is required in ViTAE.
- Extensive numerical experiments with four test cases show the advantage of the proposed ViTAE compared to state-of-art deep learning approache.
- We compared ViTAE to Kriging and Voronoi tessellation-assisted CNN in terms of both computational efficiency and reconstruction accuracy.
conda create --name vitae python=3.8
conda activate vitae

pip install torch==1.10.1+cu113 torchvision==0.11.2+cu113 -f https://download.pytorch.org/whl/cu113/torch_stable.html
pip install -r requirements.txtGenerating dataset according to simulation, voronoicnn and aq_highres.
| Dataset | Shape | Source | Comment |
|---|---|---|---|
| simu512 | 512x512 | 10000 | sp=(0.05, 0.02, 0.01, 0.005) |
| cylinder | 112x192 | 5000 | Dataset in VCNN |
| noaa | 180x360 | 1914 | Dataset in VCNN |
| PM2.5_res5km | 714x1229 | 2922 | resolution 5km |
| PM2.5_res10km | 357x615 | 2922 | resolution 10km |
| PM2.5_res20km | 184x312 | 2922 | resolution 20km |
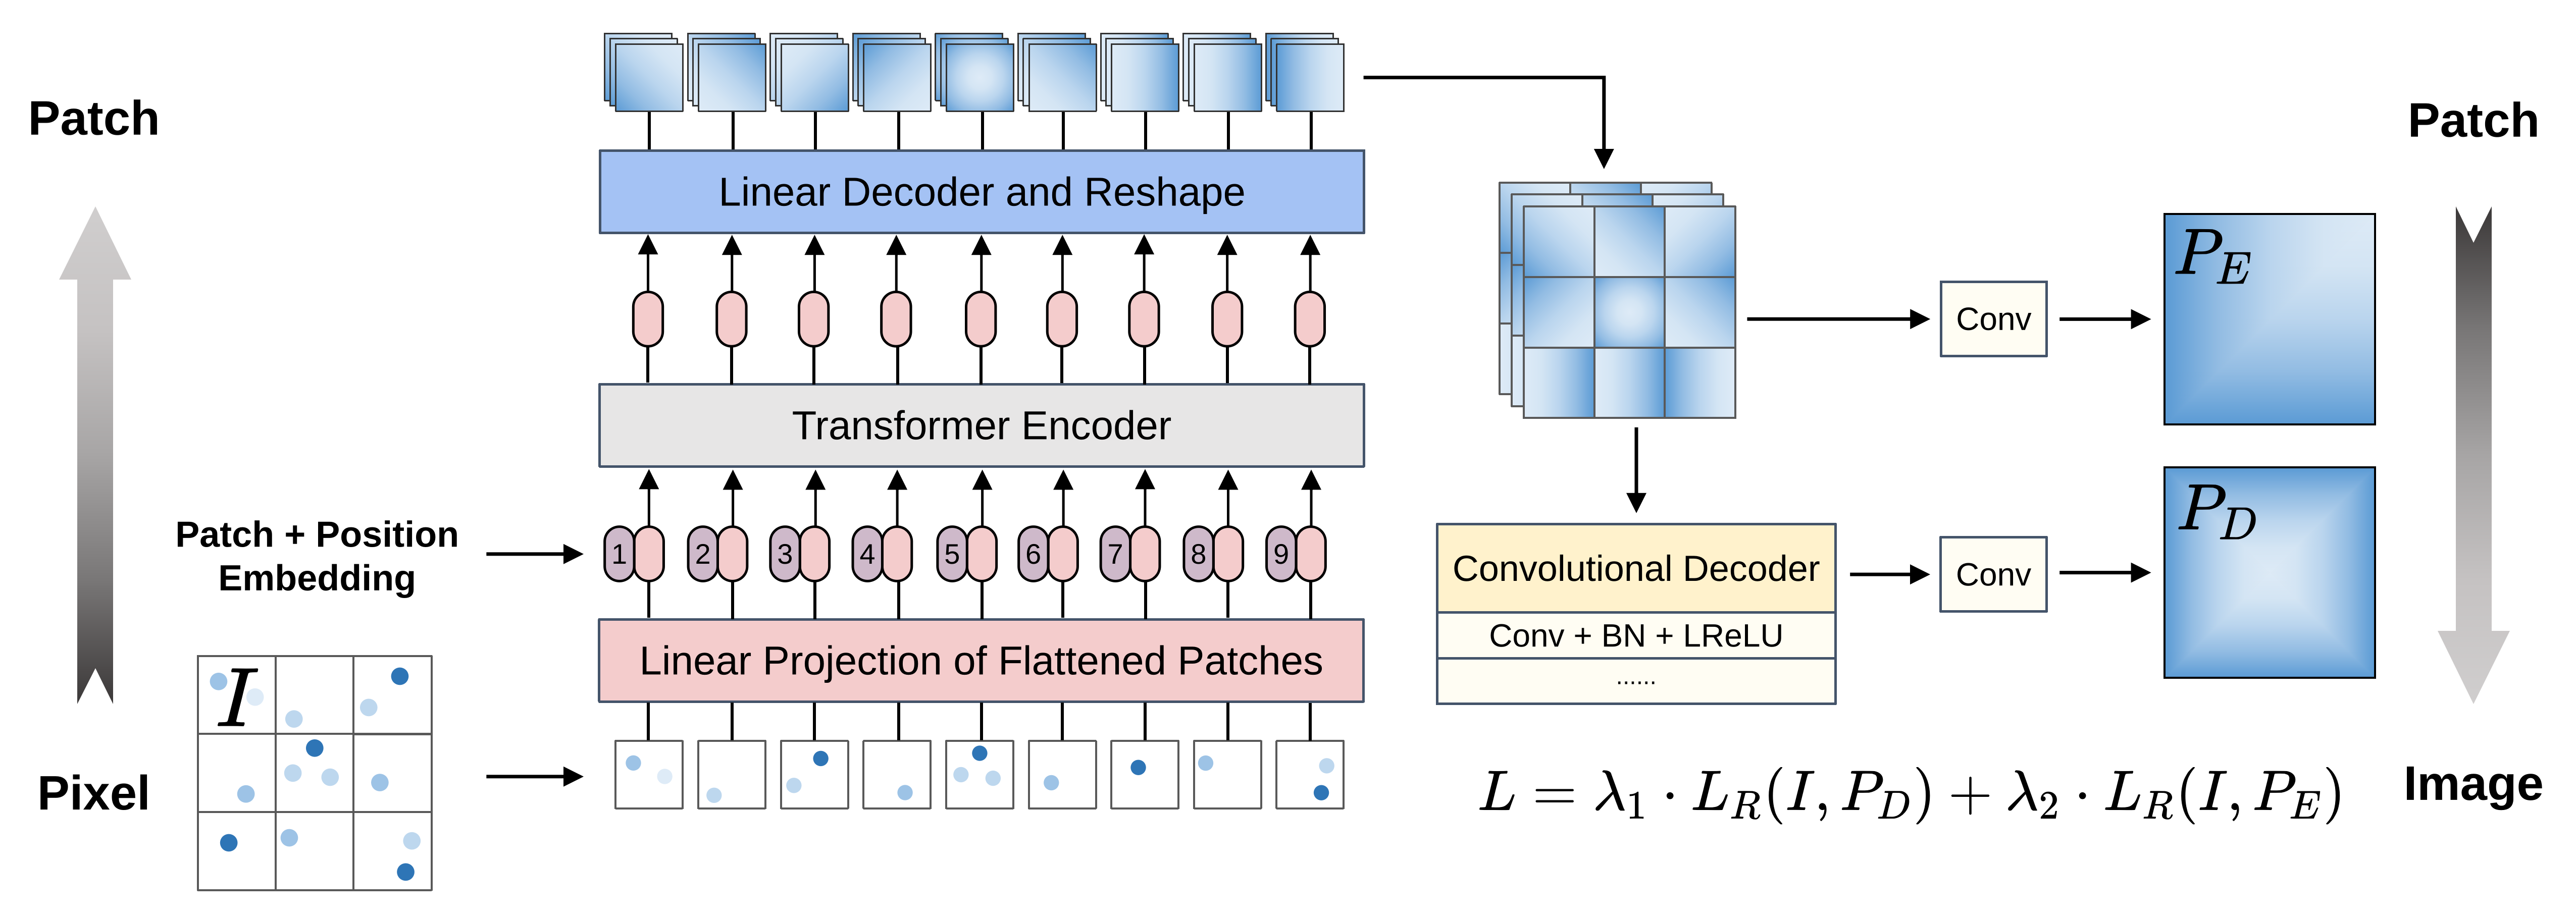
Architecture:
Run the script to train ViT-AE model for Simulation, Chinese Air Quality, Unsteady wake flow and NOAA :
./scripts/simu512/train_single.sh    # for 512x512 stimulation dataset
./scripts/aq_highres/train_single.sh # for Chinese Air Quality dataset
./scripts/noaa/train_single.sh       # for NOAA dataset
./scripts/cylinda/train_single.sh # for unsteady wake flow datasetMetric for evaluation as [1]: ε = L2Norm(Tgt − Tpred) / L2Norm(Tgt)
Tgt: Ground truth, Tpred: Prediction of ViTAE model or Voronoi-CNN (V-CNN) or Kriging interpolation
Results of test data of simu512 are listed below:
| Method | ε | ε | ε | ε | Execution time | Execution time | Execution time | Execution time |
|---|---|---|---|---|---|---|---|---|
| Kriging/RBF | 0.2243 | 0.2221 | 0.2218 | 0.2215 | 21 | 59 | 191 | 1491 |
| Kriging/Exp | 0.2553 | 0.2552 | 0.2550 | 0.2379 | 31 | 76 | 253 | 1586 |
| VCNN | 0.2324 | 0.2259 | 0.2216 | 0.2160 | 0.035 | 0.035 | 0.035 | 0.035 |
| ViTAE-lite/16 | 0.2431 | 0.2346 | 0.2290 | 0.2242 | 0.0105 | 0.0104 | 0.0105 | 0.0106 |
| ViTAE-base/16 | 0.2280 | 0.2369 | 0.2250 | 0.2234 | 0.0128 | 0.0127 | 0.0128 | 0.0128 |
| ViTAE-large/16 | 0.2255 | 0.2228 | 0.2213 | 0.2202 | 0.0150 | 0.0154 | 0.0151 | 0.0153 |
| Sampling Percent | 0.5% | 1% | 2% | 5% | 0.5% | 1% | 2% | 5% |
Performances of ViTAE, VCNN and Kriging for different observation density of simulation field reconstruction.
Results of test data of Chinese air quality are listed below:
| Model | ε | ε | ε | SSIM | SSIM | SSIM | PSNR | PSNR | PSNR | Execution time (s) |
|---|---|---|---|---|---|---|---|---|---|---|
| Kriging | 0.8599 | 0.8195 | 0.5520 | 0.7788 | 0.8195 | 0.8517 | 24.0098 | 25.0369 | 25.8168 | 117.5 |
| VCNN | 0.3978 | 0.3527 | 0.3261 | 0.9385 | 0.9340 | 0.9321 | 29.7478 | 30.3167 | 30.4041 | 0.0063 |
| ViTAE-lite | 0.3571 | 0.3389 | 0.3245 | 0.9421 | 0.9330 | 0.9271 | 30.8184 | 30.8221 | 30.4489 | 0.0053 |
| ViTAE-base | 0.3570 | 0.3434 | 0.3129 | 0.9451 | 0.9366 | 0.9377 | 30.9079 | 30.7691 | 30.8588 | 0.0058 |
| ViTAE-large | 0.3566 | 0.3371 | 0.3205 | 0.9471 | 0.9399 | 0.9304 | 30.9466 | 30.9628 | 30.6220 | 0.0061 |
| Monitor Percent | 0.13% | 0.52% | 2.08% | 0.13% | 0.52% | 2.08% | 0.13% | 0.52% | 2.08% | 0.13% |
Performances of ViTAE, VCNN and Kriging for different observation density of Chinese air quality

Results of test data of Unsteady wake flow are listed below:
| Model | ε | ε | ε | Execution time (s) |
|---|---|---|---|---|
| VCNN | 0.0230 | 64.55 | 0.9988 | 0.0016 |
| ViTAT-lite/8 | 0.0112 | 70.63 | 0.9988 | 0.0043 |
| ViTAE-base/8 | 0.0050 | 77.56 | 0.9999 | 0.0050 |
| ViTAE-large/8 | 0.0023 | 84.37 | 0.9988 | 0.0052 |
Performances of ViTAE and VCNN for different observation density of Unsteady wake flow

Performances of ViTAE and NOAA for sparse observations.
NOAA field reconstruction performances of ViTAE and VCNN for various input observations.


