Nginx-Log-Analyzer is a lightweight (simplistic) log analyzer, used to analyze Nginx access logs for myself.
Nginx-Log-Analyzer is written in Go programming language, needs only a 2 MB executable file to run, currently supported features are as follows:
- Filter logs based on the request time
- Support multiple log format configurations
- combined (Nginx default configuration)
- JSON
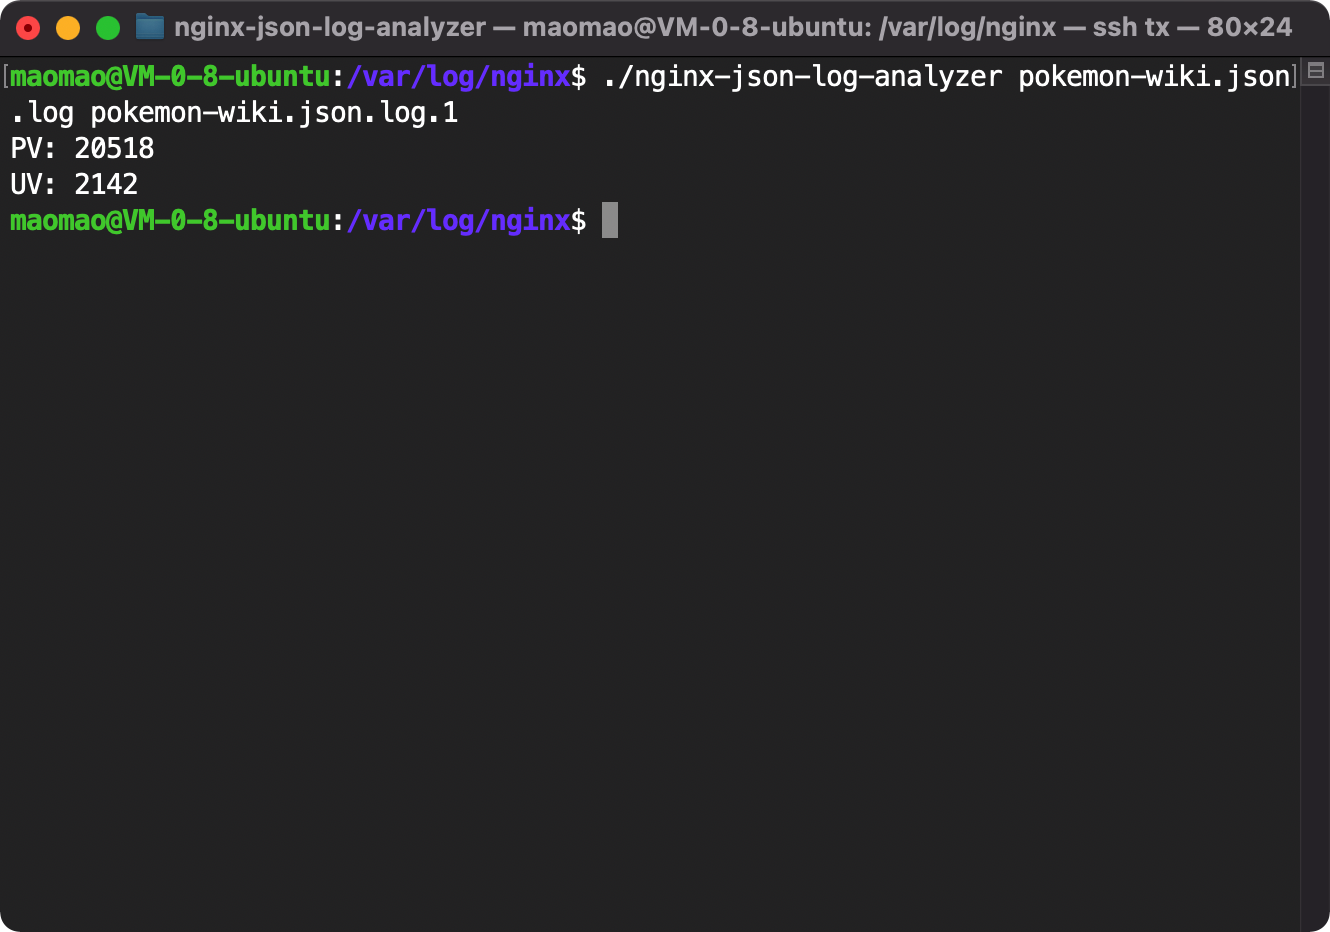
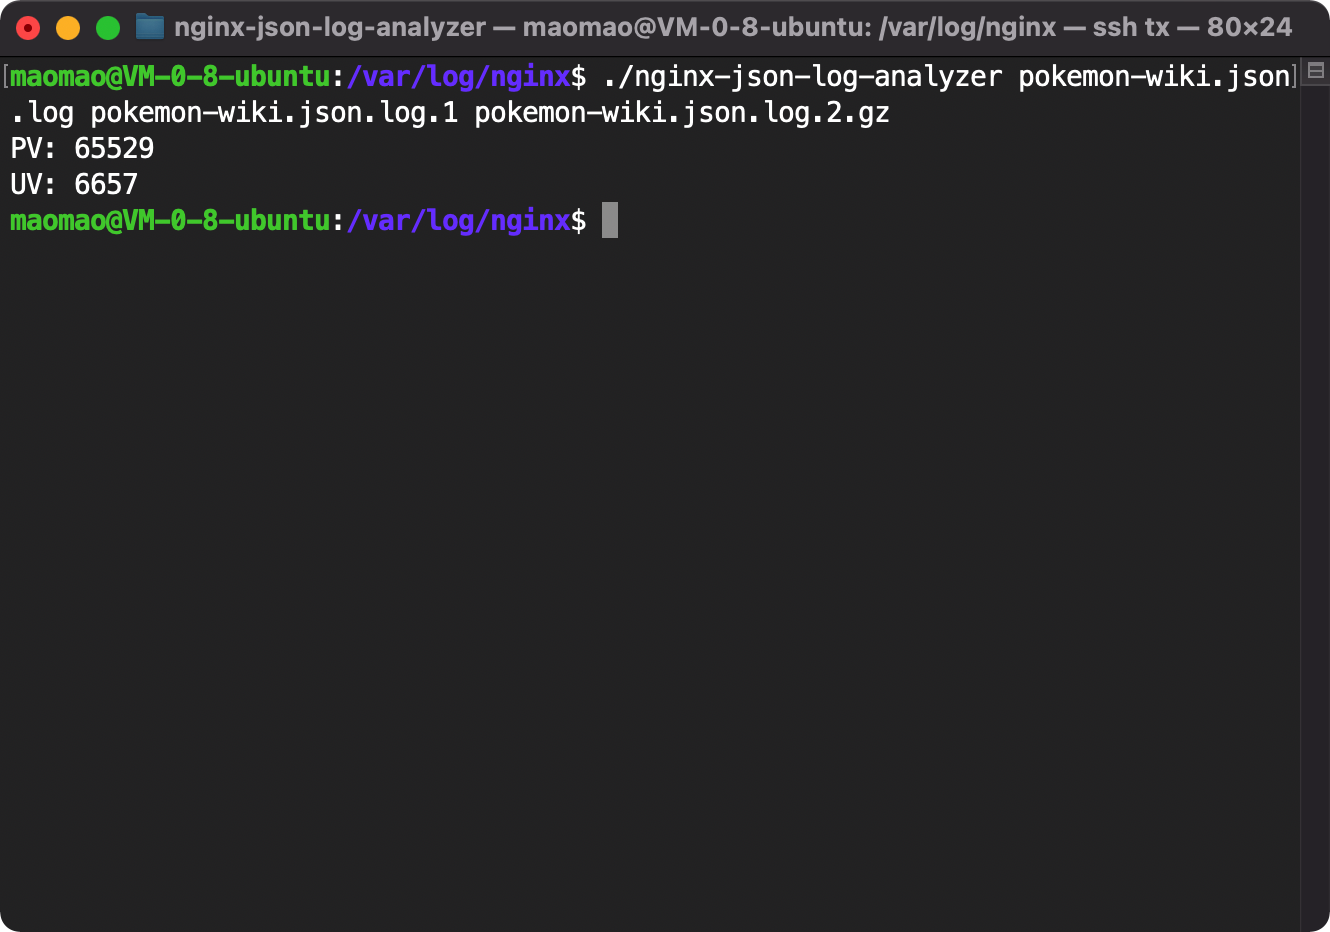
- Analyze multiple files at the same time
- Analyze .gz compressed files
- Support a variety of statistical indicators
Advantages compared to GoAccess
GoAccess is an excellent and powerful real-time web log analyzer, interactive viewer that runs in a terminal in *nix systems or through your browser. But as far as I know, GoAccess seems does not support counting URI response time by percentile, Nginx-Log-Analyzer supports this feature.
If I knew about GoAccess before developing Nginx-Log-Analyzer, I might choose to use it directly. GoAccess is so powerful, I love GoAccess.
Advantages compared to ELK
Although ELK is powerful, it is troublesome to install and configure, and it also has certain requirements for machine performance. Nginx-Log-Analyzer is more lightweight and easier to use, suitable for some simple log analysis scenarios.
Just download the binary executable file for the corresponding platform from the GitHub Release page of Nginx-Log-Analyzer.
GeoIP2 is a commercial IP geolocation database, need to pay to use it. GeoLite2 is a free and low-precision version of GeoIP2, distribute by Attribution-ShareAlike 4.0 International license, download by logging in to the MaxMind official website.
When using Nginx-Log-Analyzer, if you need to resolve the geographic location of the IP (that is, use the -t 4
mode), then you will need to download the GeoIP2 or GeoLite2 City database file, save it to the City.mmdb file in the
default configuration directory ${HOME}/.config/nginx-log-analyzer/. The corresponding shell commands are as follows:
~$ mkdir -p ${HOME}/.config/nginx-log-analyzer
~$ tar -xzf GeoLite2-City_20211109.tar.gz
~$ cp GeoLite2-City_20211109/GeoLite2-City.mmdb ${HOME}/.config/nginx-log-analyzer/City.mmdbNginx-Log-Analyzer parses Nginx access logs in combined format by default, which means that the logs will contain the following fields:
- $remote_addr
- $remote_user
- $time_local
- $request
- $status
- $body_bytes_sent
- $http_referer
- $http_user_agent
When using Nginx-Log-Analyzer, if you need more types of statistical indicators, then
you will need to use the -lf json option to specify the log parsing mode to the JSON format, and need to add the
following log_format and access_log directives in the Nginx configuration:
log_format json_log escape=json '{"remote_addr":"$remote_addr",'
                                '"time_local":"$time_local",'
                                '"request":"$request",'
                                '"status":$status,'
                                '"body_bytes_sent":$body_bytes_sent,'
                                '"http_user_agent":"$http_user_agent",'
                                '"request_time":$request_time}';
access_log /path/to/access.json.log json_log;
- The
log_formatdirective can only appear in thehttpcontext; - The
access_logdirective could appear in thehttp,server,locationcontext, and should use thelog_formatdeclared above; - You can make multiple
access_logs at the same time without deleting the original configuration. e.g.access_log /path/to/access.log; access_log /path/to/access.json.log json_log;
Related document: http://nginx.org/en/docs/http/ngx_http_log_module.html
The -v options show Nginx-Log-Analyzer's build version, build time, and Git Commit at build time.
The -d option specify the configuration directory that Nginx-Log-Analyzer required at runtime, the default value
is ${HOME}/.config/nginx-log-analyzer/.
The -lf option specify the log format parsed by Nginx-Log-Analyzer, available values are combined and json, the
default value is combined.
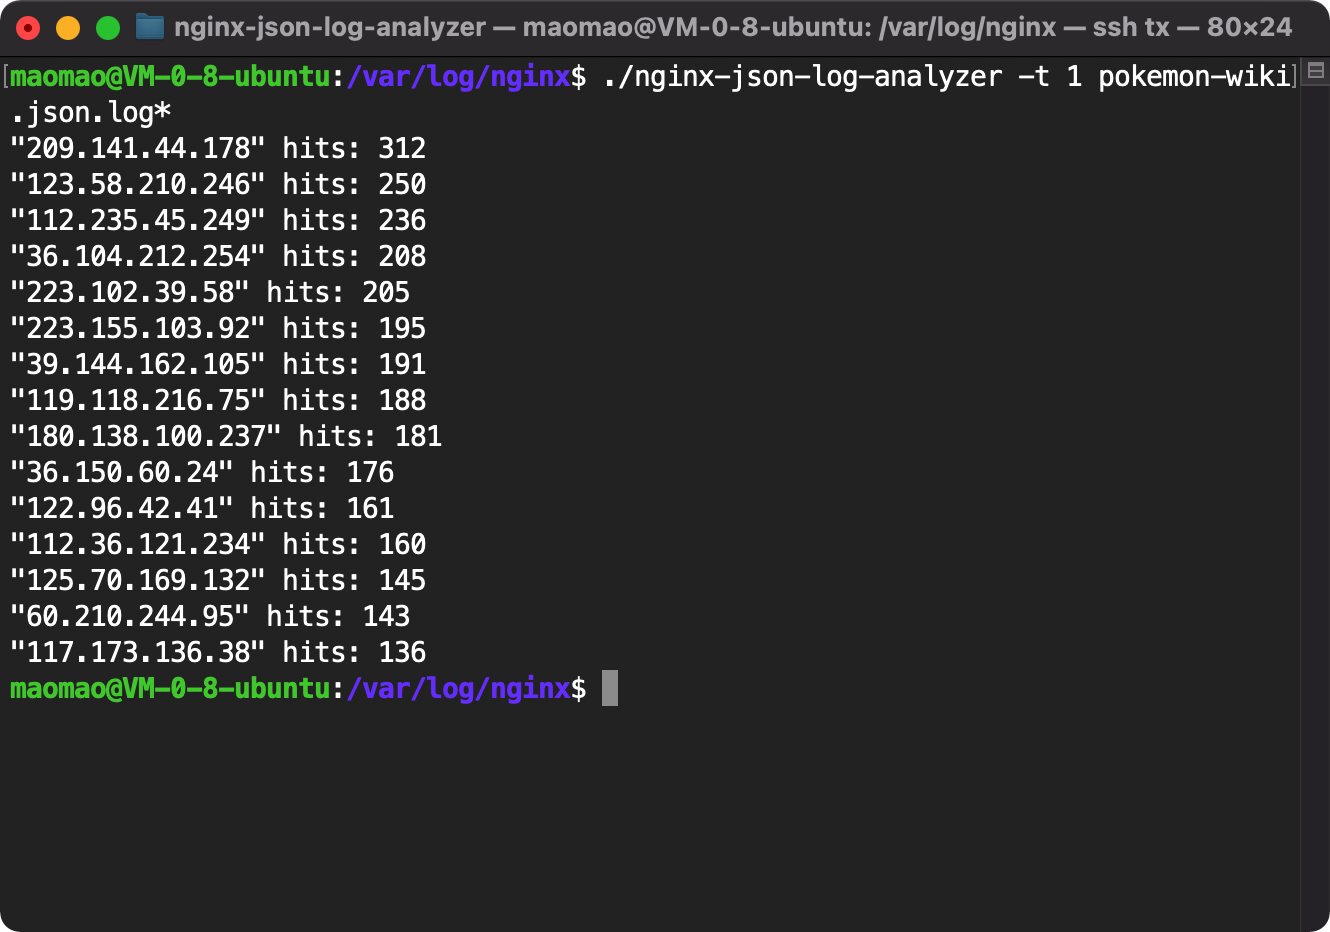
The -t option specify the type of this analysis, the analysis type and corresponding statistical indicators are as
follows:
| Supported | Analysis Type -t |
Statistical Indicators | Required Fields or Libraries |
|---|---|---|---|
| ✅ | 0 | PV and UV | $remote_addr |
| ✅ | 1 | Most visited IPs | $remote_addr |
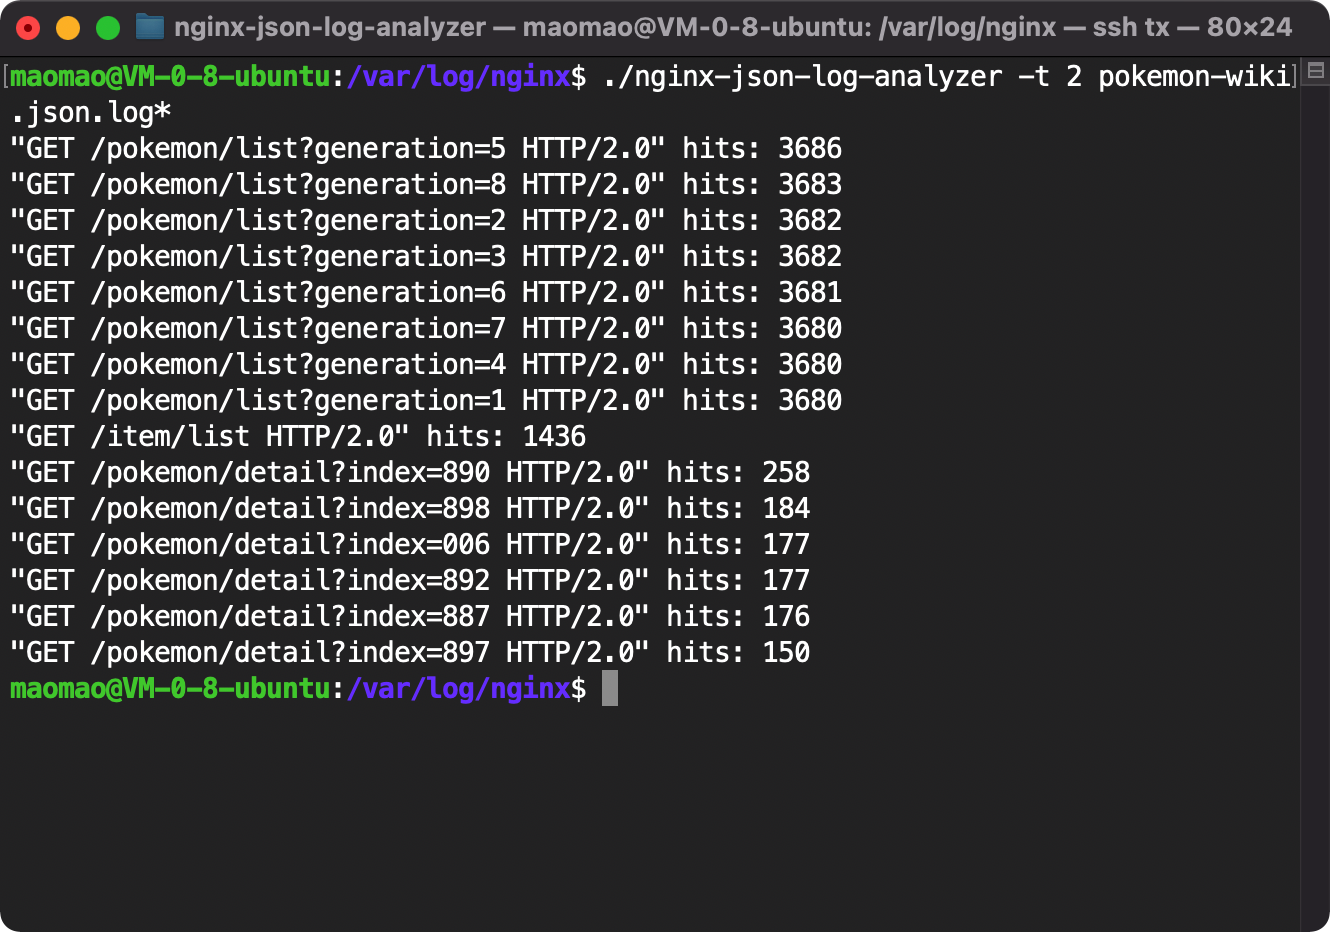
| ✅ | 2 | Most visited URIs | $request |
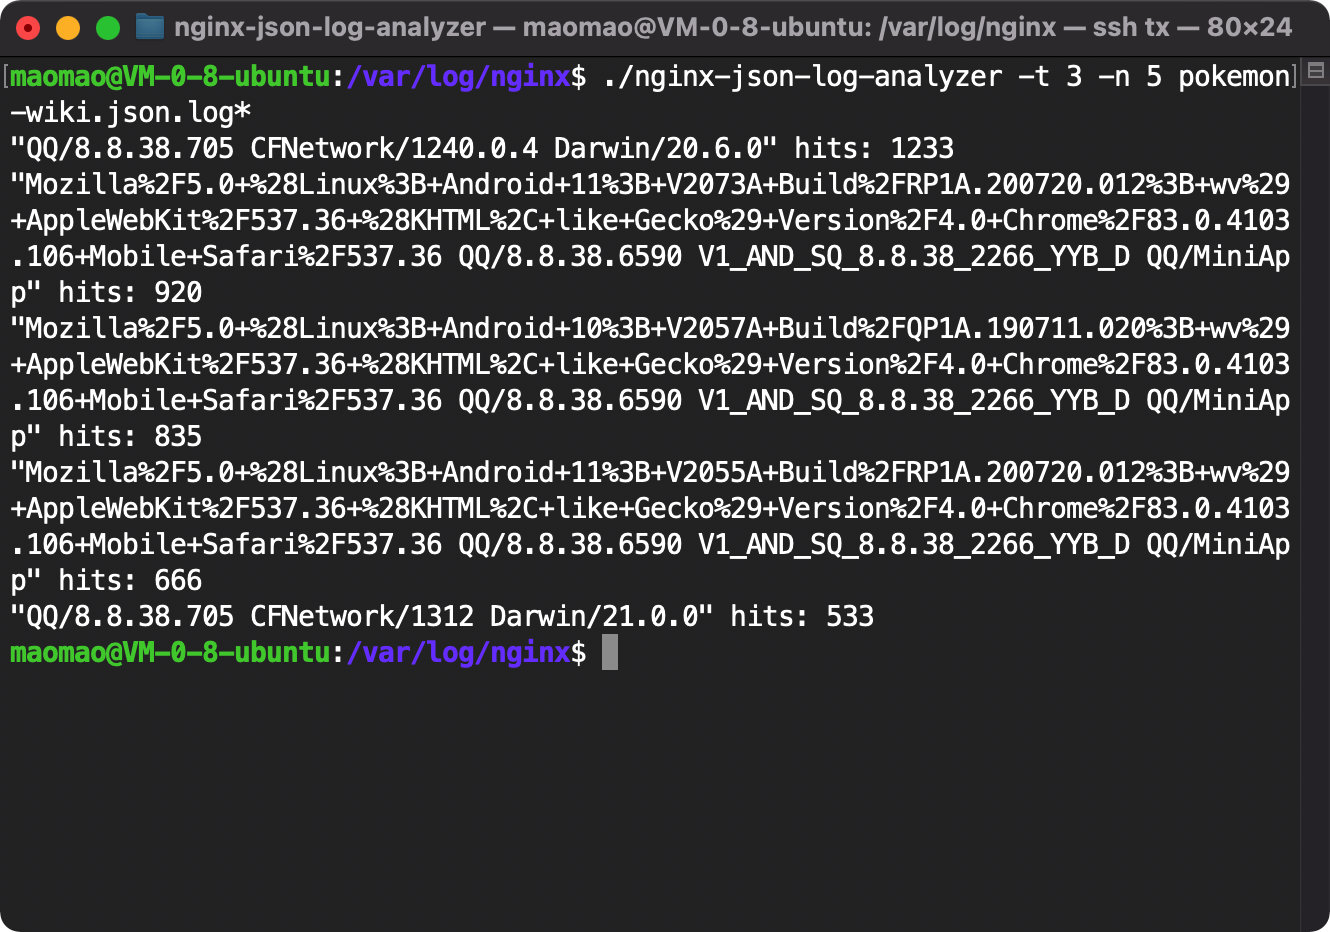
| ✅ | 3 | Most visited User-Agents | $http_user_agent |
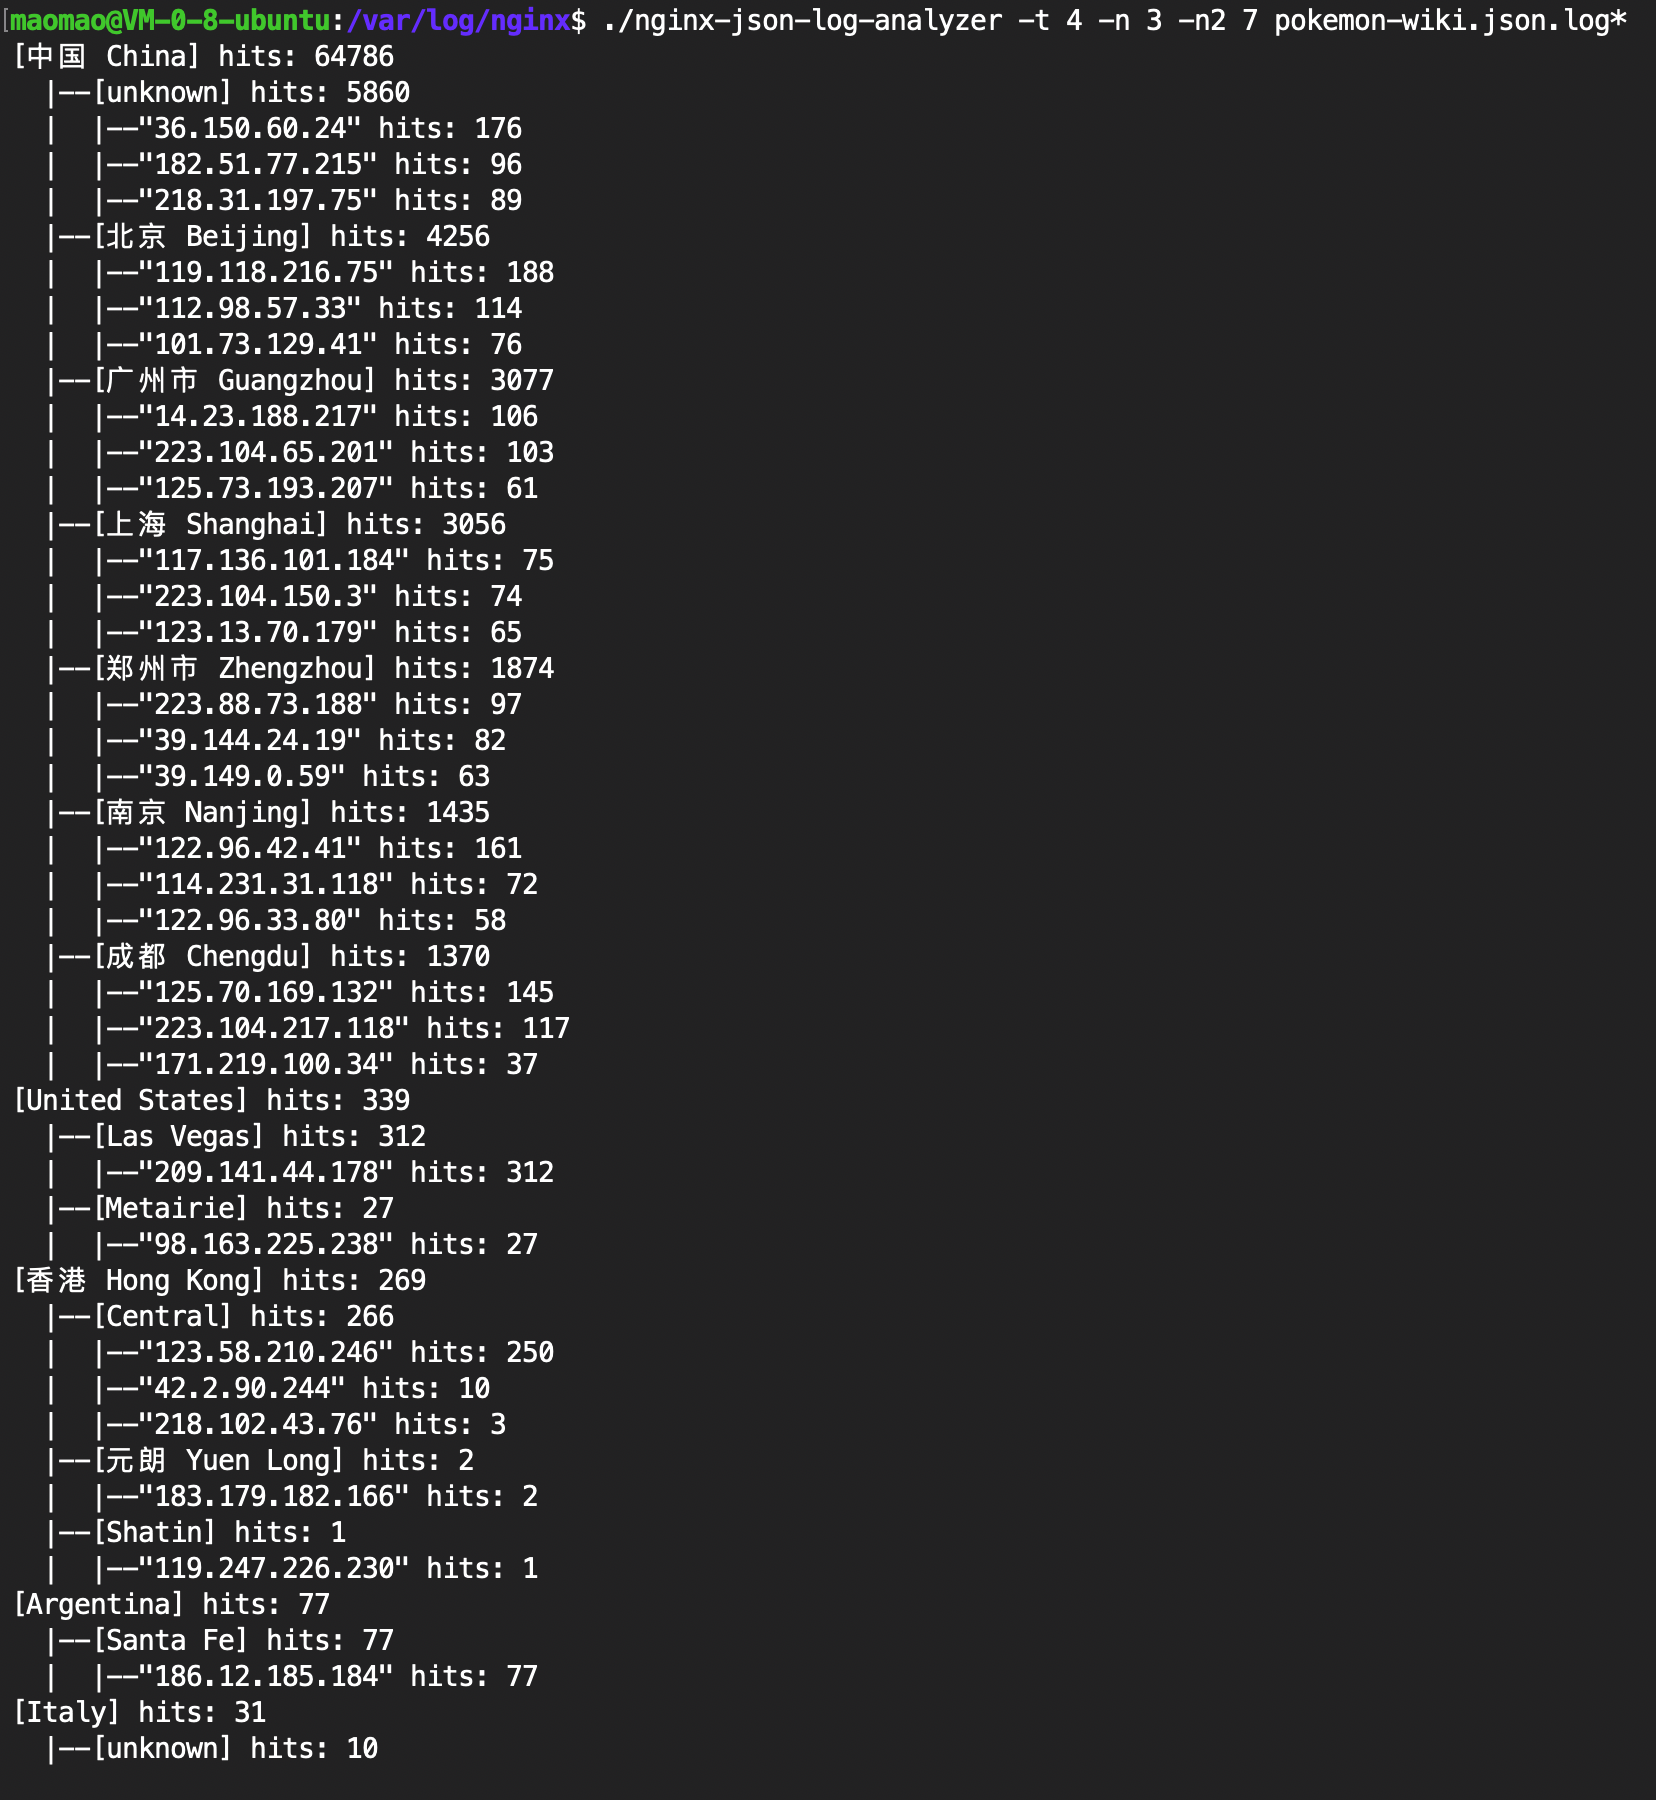
| ✅ | 4 | Most visited user countries and cities | $remote_addr, MaxMind GeoIP2 or GeoLite2 City Database |
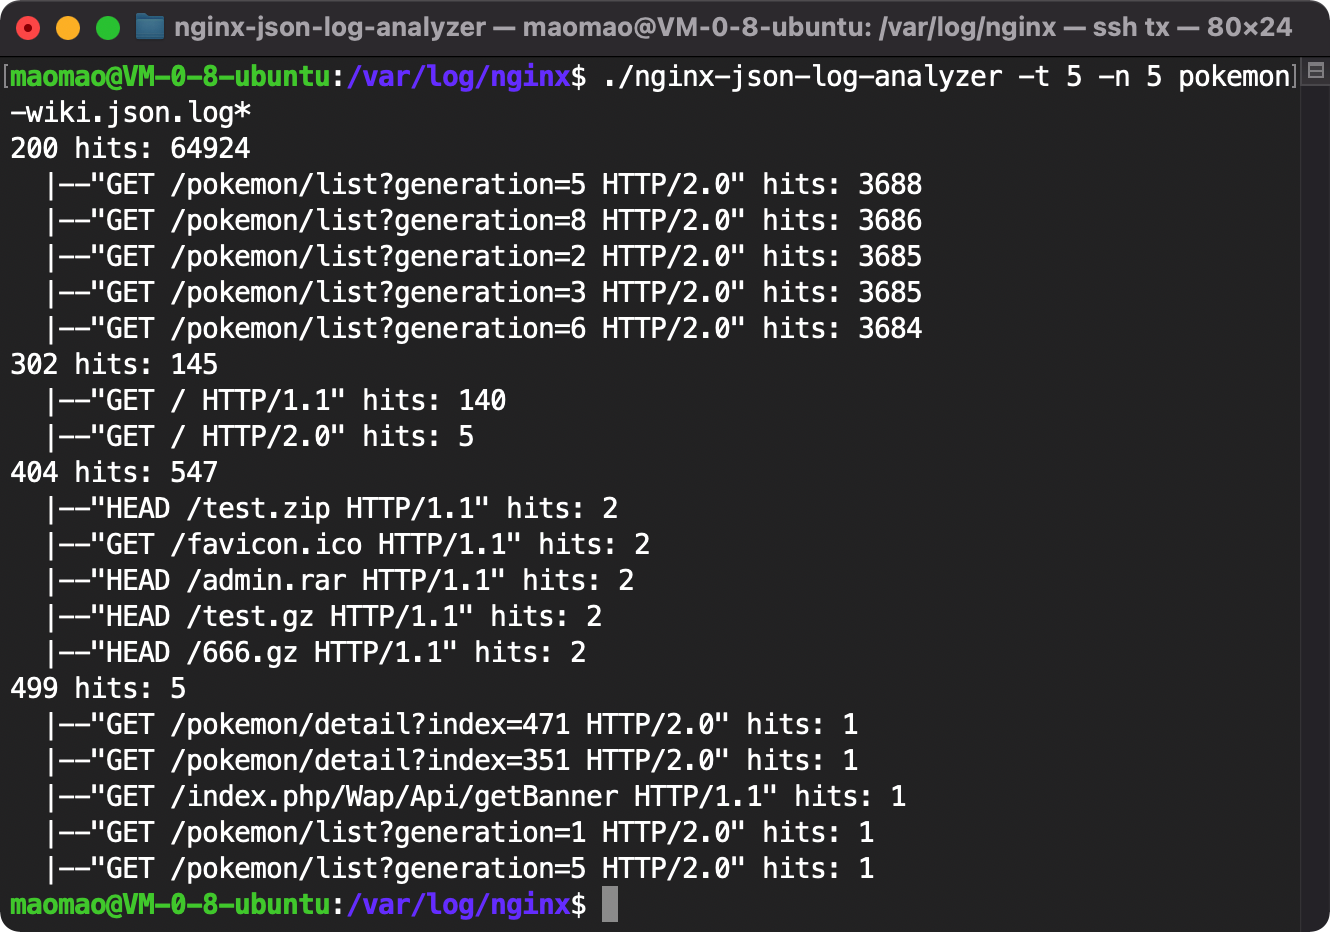
| ✅ | 5 | Most frequent response status | $status, $request |
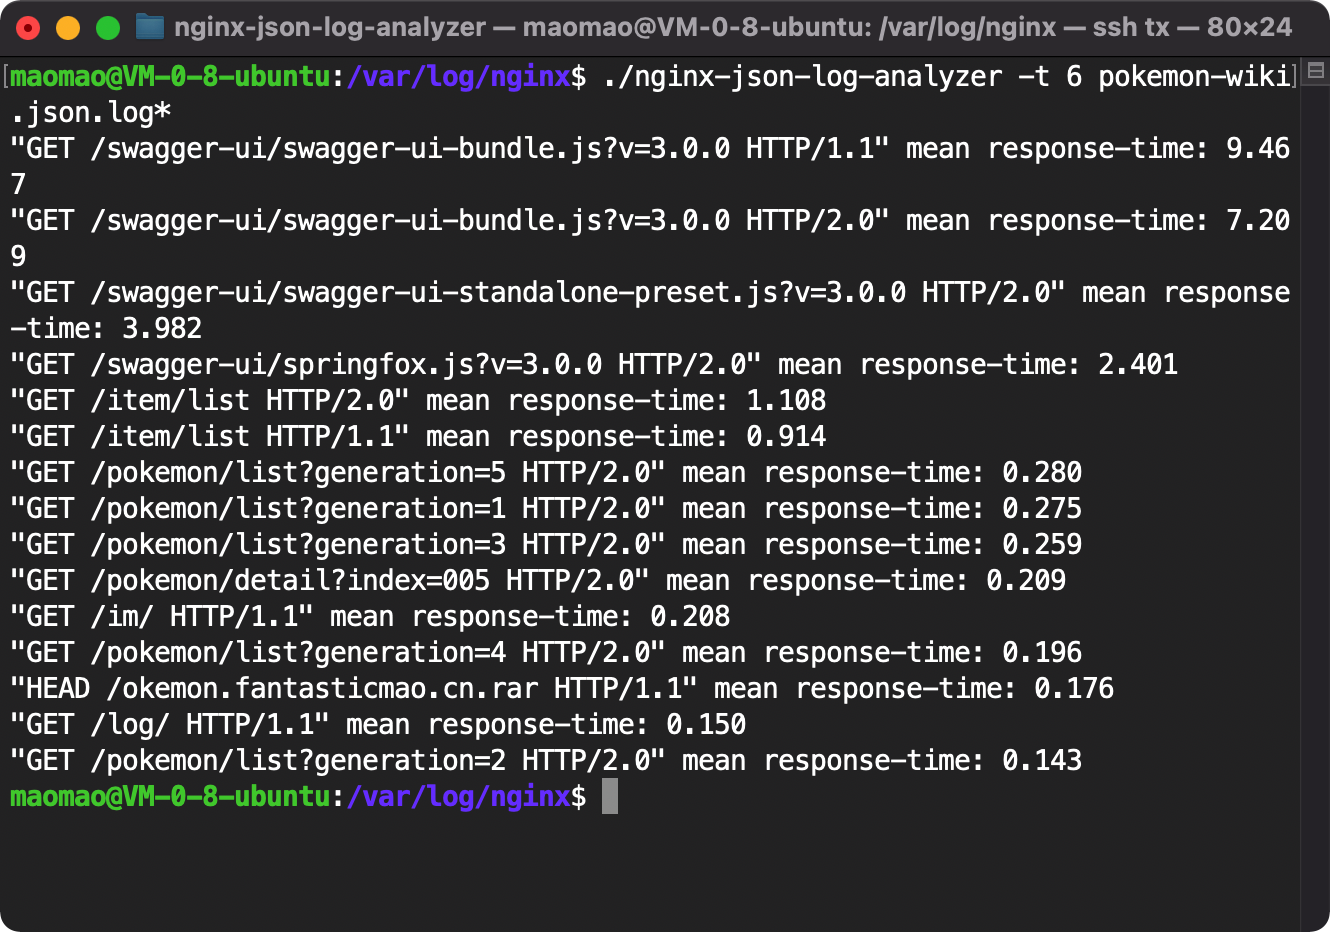
| ✅ | 6 | Largest average response time URIs | $request, $request_time |
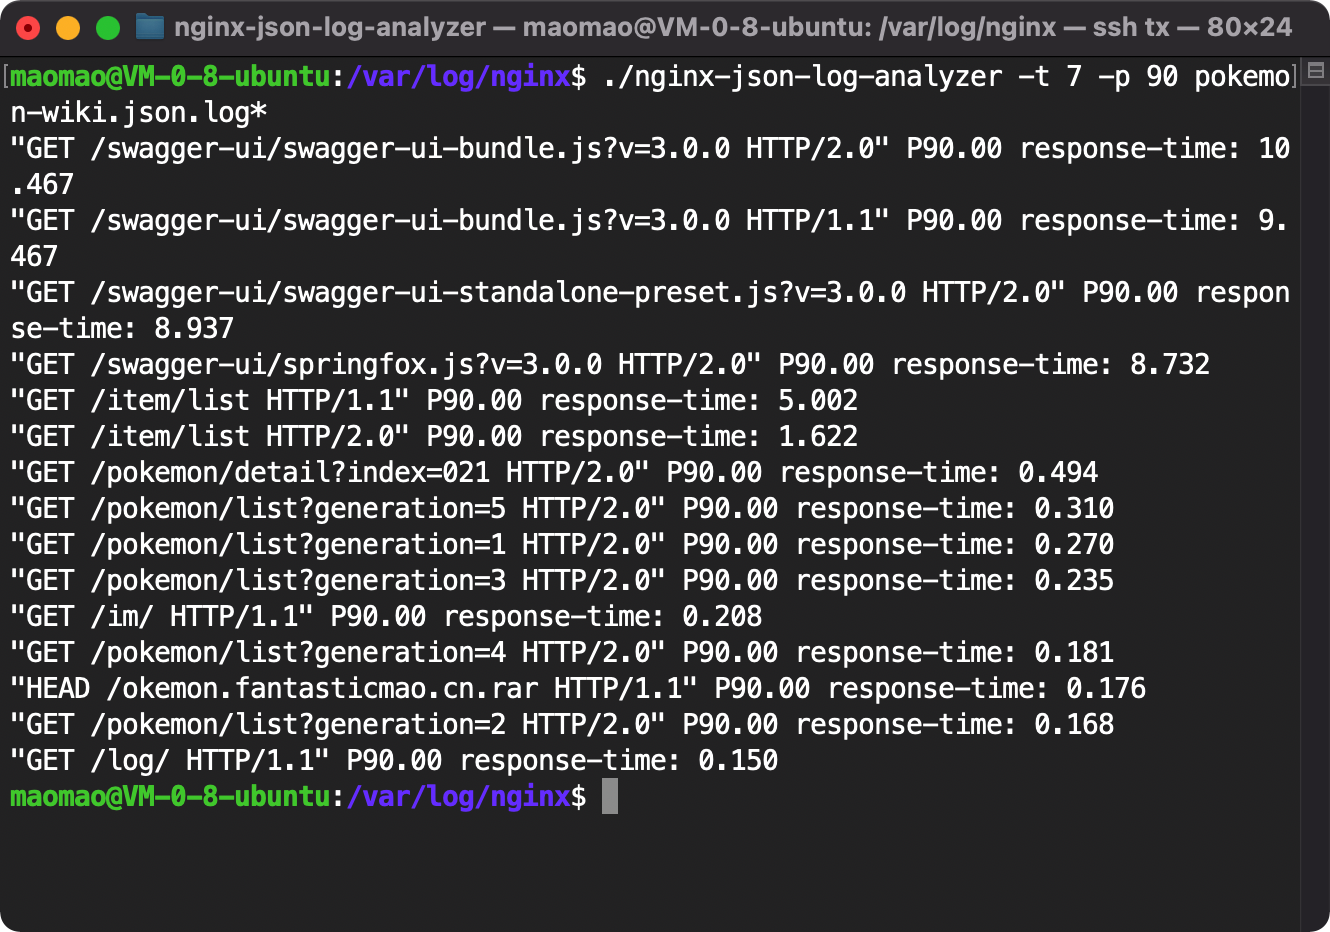
| ✅ | 7 | Largest percentile response time URIs, e.g. p1(min), p50(median), p95, p100(max) | $request, $request_time |
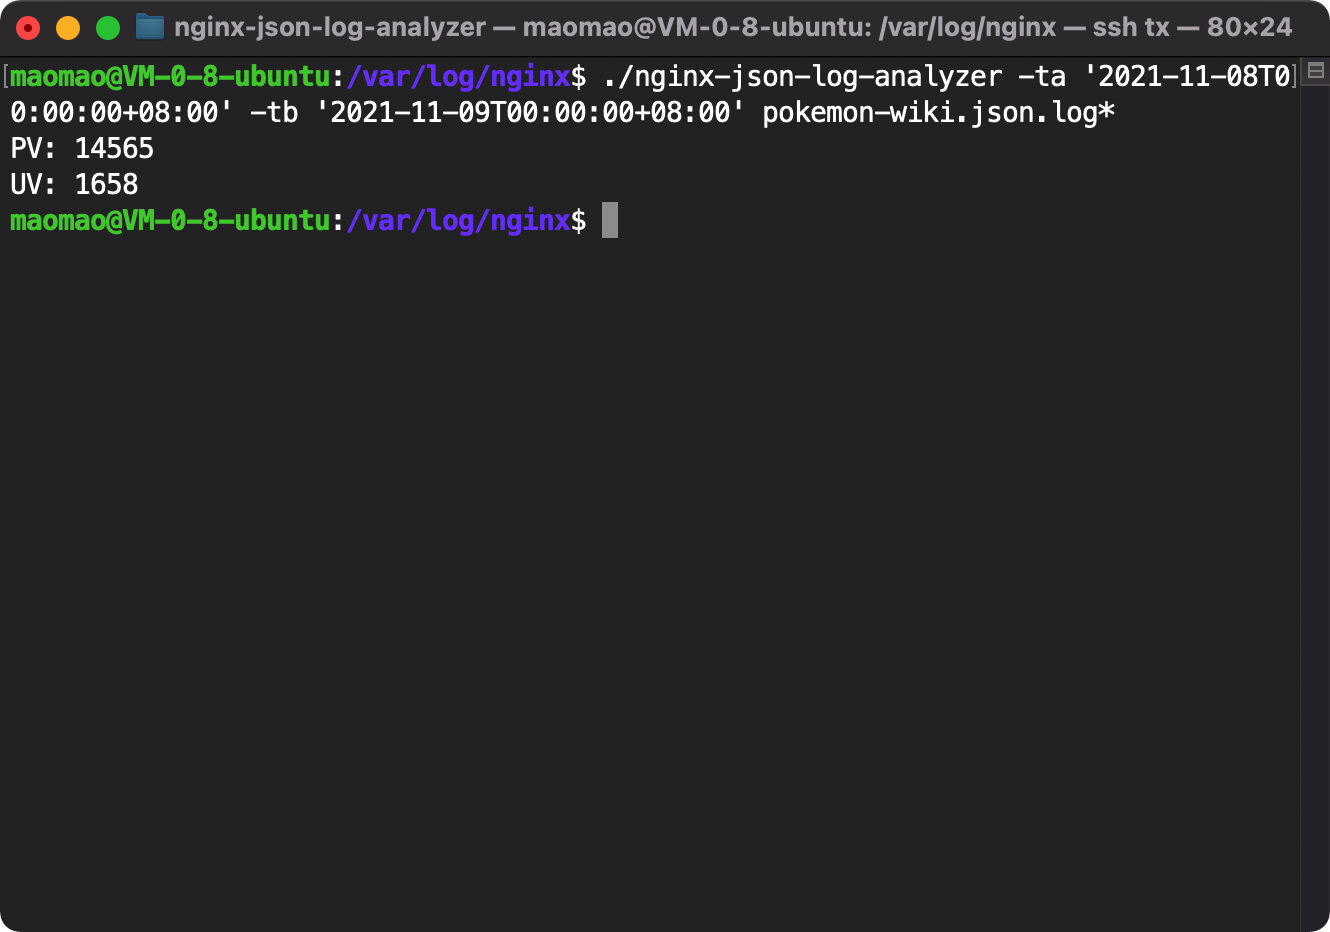
-ta and -tb options are used to filter logs based on the request time, ta is the abbreviation of time after, tb
is the abbreviation of time before.
-ta and -tb options required the $time_local field in log_format directive of Nginx configuration.
-n and -n2 options are used to limit the number of output lines of Nginx-Log-Analyzer, -n2 option only works
in -t 4 mode.
The -p option specify the percentile value in the -t 7 mode, the default value is 95.
Q: Will it support real-time analysis in the future?
A: No. If you want this feature, it is recommended to use solutions such as GoAccess, ELK, Grafana + Time Series DBMS.
GeoLite2 Database License
Nginx-Log-Analyzer License
Copyright (c) 2021 fantasticmao


