A javascript library (using jQuery) that creates html-and-css-only bar charts. This is for my submission of the pre-course prep work for the Lighthouse Labs Full-Stack Web Developer program.
drawBarChart(data, options, element);data can be either an array, or an object literal. You can provide an array
either as a one-dimensional array of values to plot, producing a standard bar
chart; or as a two-dimensional array, producing a stacked bar chart. Supplying
an object literal instead allows you to provide x-axis labels and/or
stacked-bar-chart categories (used to generate a legend).
[ value1, value2, ... ]generates a standard bar chart with the values as x-axis labels[ [aValue1, aValue2, ...], [aValue1, aValue2, ...], ... ]generates a stacked bar chart{ "xAxisLabel1": value1, "xAxisLabel2": value2, ... }generates a standard bar chart with the given x-axis labels{ "xAxisLabel1": { "category1": value1A, "category2": value2A, ... }, "xAxisLabel2": { "category1": value1B, "category2": value2B, ... }, ... }generates a stacked bar chart with x-axis labels and a legend with categories
Any of the forms that produce a stacked bar-chart should be combined with a
barColor option (see below) to delineate between the sections of the bar.
N.B.: To create a stacked bar-chart with no legend, use the first object-literal form above, and supply a one-dimensional array of values in place of the individual values.
options is a javascript literal that can contain the following properties:
title: a string specifying the title to display for the charttitleSize: a string specifying the CSS font-size to use for the suplied tile of the charttitleColor: a string specifying the color of the title. Must be a valid CSS color (named color, hex value, etc.).width: (default500px) a string specifying the width of the chart. Must be a CSS unit (px, %, em, etc.).height: (default300px) a string specifying the height of the chart. Must be a CSS unit (px, %, em, etc.).xAxisName: a string specifying the name of the x-axis to display on the chart.yAxisName: a string specifying the name of the y-axis to display on the chart.valueLabelPosition: one of "top" (default), "center", or "bottom", specifying the positioning of the value label for each bar on the bar chart.valueLabelColor: a string specifying the color of the value label on each bar. Must be any valid CSS color (named color, hex value, etc.).barColor: a string specifying the color of the bars on the chart. Must be any valid CSS color (named color, hex value, etc.). For a stacked bar chart, you can pass in an array of colors forbarcolorto specify the color of each section of the stack.barSpacing: a string specifying the space between (and around) the bars of the chart. Must be a CSS unit (px, %, em, etc.).showTicks: a boolean value (default isfalse) specifying whether to show tick marks and values on the y-axislegendPosition: an object literal specifying the absolute positioning of the legend (if any) relative to the generated chart; this defaults to{ top: "0", left: "30px" }
element is the html (or jQuery) element that you want the chart to be inserted
into.
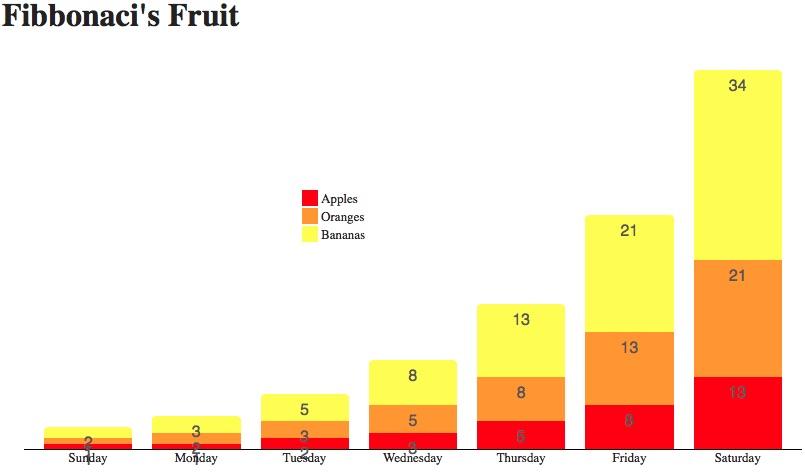
Here is an example of what you can achieve with this library:
To draw the chart of your dreams, simply copy /docs/js/bar-chart.js from this
repository to your project, link it into your page, and call the drawBarchart
function like in the examples below, using the parameters and options detailed
above!
Draws a standard bar chart, specifies a height of 500 pixels, and places the bar labels at the bottom of each bar:
drawBarChart([1, 2, 3, 4, 5], {
  "height": "500px",
  "labelPosition": "bottom"
}, $("#my-bar-chart"));
Draws a stacked bar chart with a legend and colors, specifying a height of 500 pixels and a width of 800 pixels, spacing between bars of 20 pixels, and an x-axis title:
drawBarChart({
  "Monday": { "Strawberries": 1, "Avocados": 1, "Blueberries": 2 },
  "Tuesday": { "Strawberries": 1, "Avocados": 2, "Blueberries": 3 },
  "Wednesday": { "Strawberries": 2, "Avocados": 3, "Blueberries": 5 },
  "Thursday": { "Strawberries": 3, "Avocados": 5, "Blueberries": 8 },
  "Friday": { "Strawberries": 5, "Avocados": 8, "Blueberries": 13 }
  }, {
  height: "500px",
  width: "800px",
  barSpacing: "20px",
  xAxisName: "Weekday",
  barColor: [ "red", "green", "blue" ]
}, $("#my-bar-chart"));
Known issues for this library are as follows:
- Value labels (which must be drawn) appear to overflow onto other content when the bar/bar-section is too small to contain it
- Negative values cannot be plotted
- When no x-axis categories are supplied, the values are used as x-axis labels, sometimes yielding undesirable results, and this cannot be turned off
The algorithm to determine the optimal tick-mark interval (which is then used to determine the scale of the chart) is adapted from Mark Ransom's reply to this StackOverflow thread. Many thanks to Mark!
