The project has been mooved to sckit-hep.
For all future fork/clone, please usse the new link.
This is a python version of the BumpHunter algorithm, see arXiv:1101.0390, G. Choudalakis, designed to find localized excess (or deficit) of events in a 1D distribution.
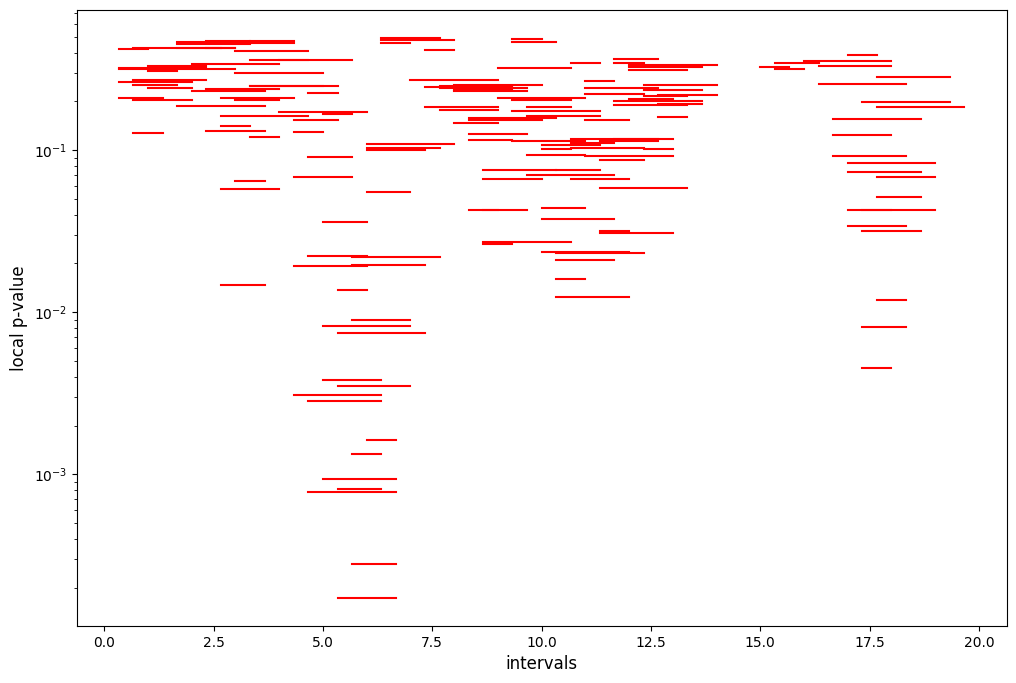
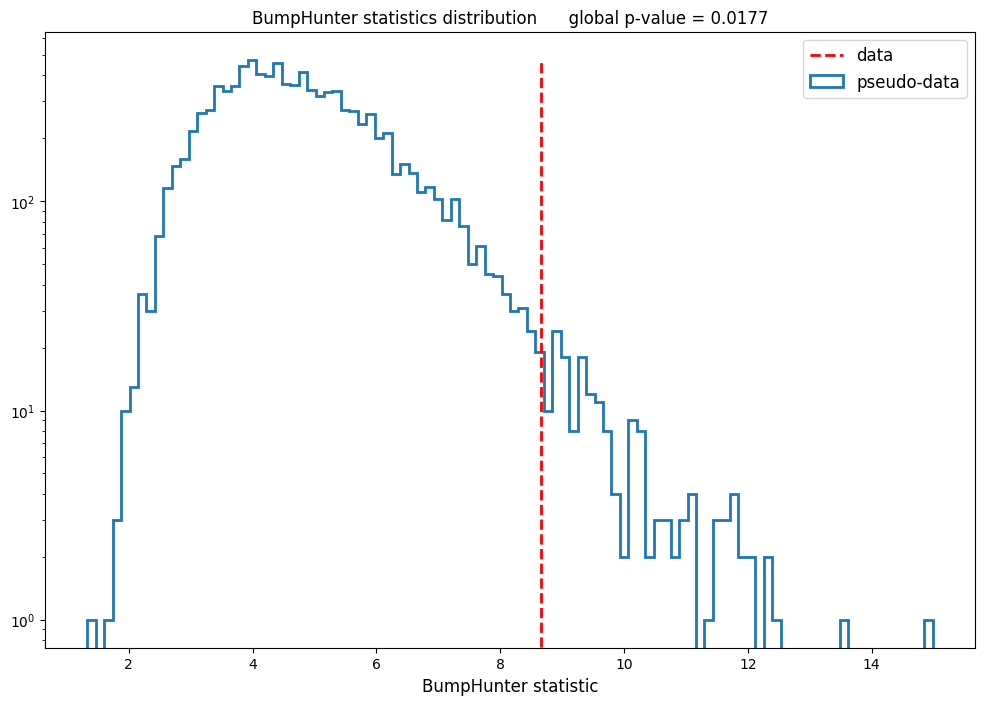
The main BumpHunter function will scan a data distribution using variable-width window sizes and calculate the p-value of data with respect to a given background distribution in each window. The minimum p-value obtained from all windows is the local p-value. To cope with the "look-elsewhere effect" a global p-value is calculated by performing background-only pseudo-experiments.
The BumpHunter algorithm can also perform signal injection tests where more and more signal is injected in toy data until a given signal significance (global) is reached.
- pyBumpHunter : The pyBumpHunter package
- example/example.py : A little example script that use pyBumpHunter
- example/example.ipynb : A little example notebook that use pyBumpHunter
- example/results : Folder containing the outputs of example script
- testing : Folder containing the testing scripts (based on pytest)
- data/data.root : Toy data used in the examples and tests
- data/gen_data.C : Code used to generate the toy data with ROOT
Requires python >= 3.5
pyBumpHunter depends on the following python libraries :
- numpy
- scipy
- matplotlib
The examples provided in example.py and test.ipynb require the uproot package in order to read the data from a ROOT software file.
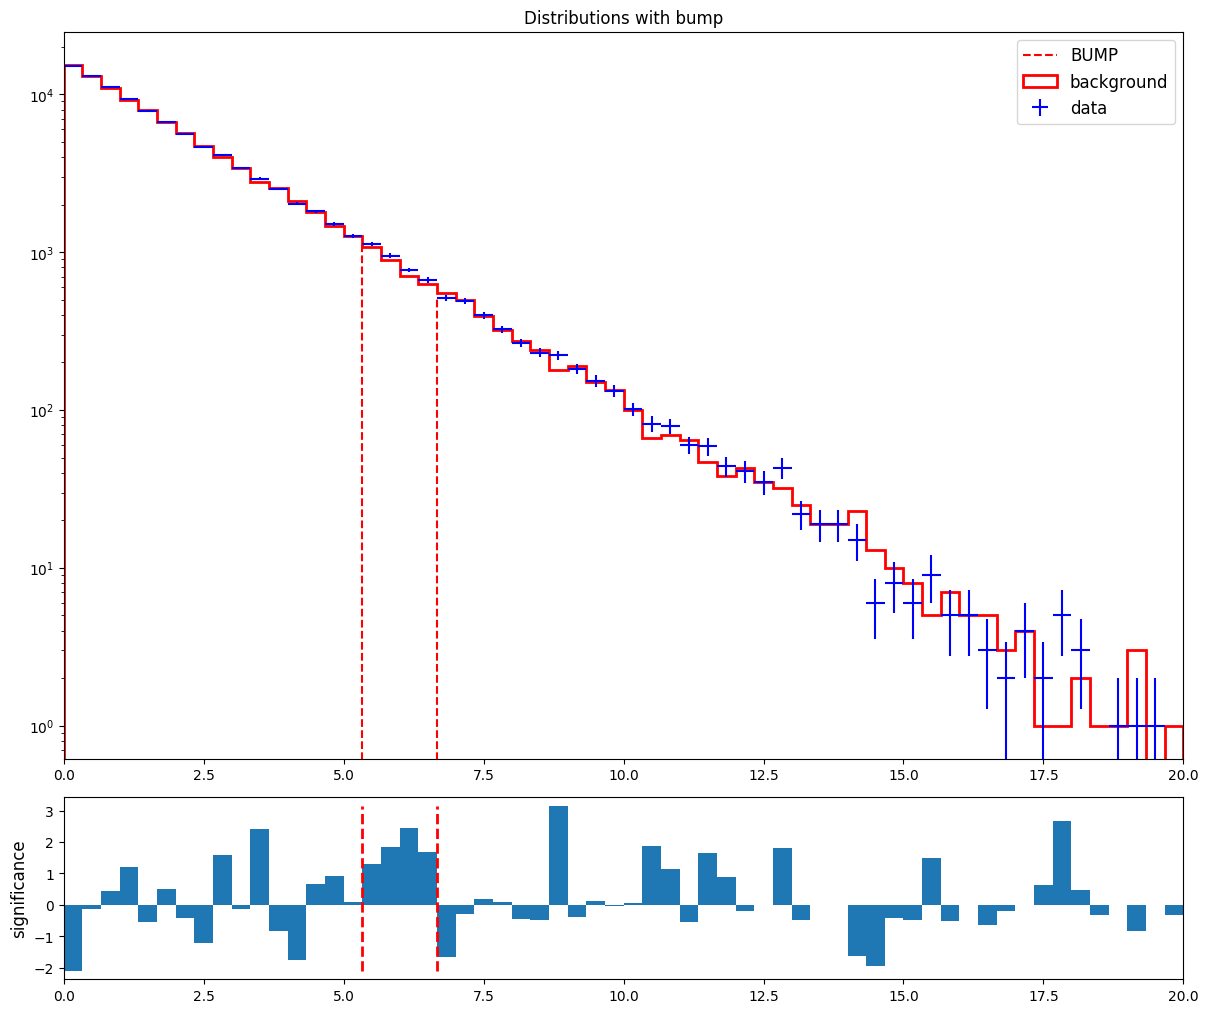
The data provided in the example consists of three histograms: a steeply falling 'background' distribution in a [0,20] x-axis range, a 'signal' gaussian shape centered on a value of 5.5, and a 'data' distribution sampled from background and signal distributions, with a signal fraction of 0.15%. The data file is produced by running gen_data.C in ROOT.
In order to run the example script, simply type python3 example.py in a terminal.
You can also open the example notebook with jupyter or binder.
- Bump hunting:
- Tomography scan:
- Test statistics and global p-value:
See the wiki for a detailed overview of all the features offered by pyBumpHunter.
- Run BH on 2D histograms
Louis Vaslin (main developper), Julien Donini
Thanks to Samuel Calvet for his help in cross-checking and validating pyBumpHunter against the (internal) C++ version of BumpHunter developped by the ATLAS collaboration.


