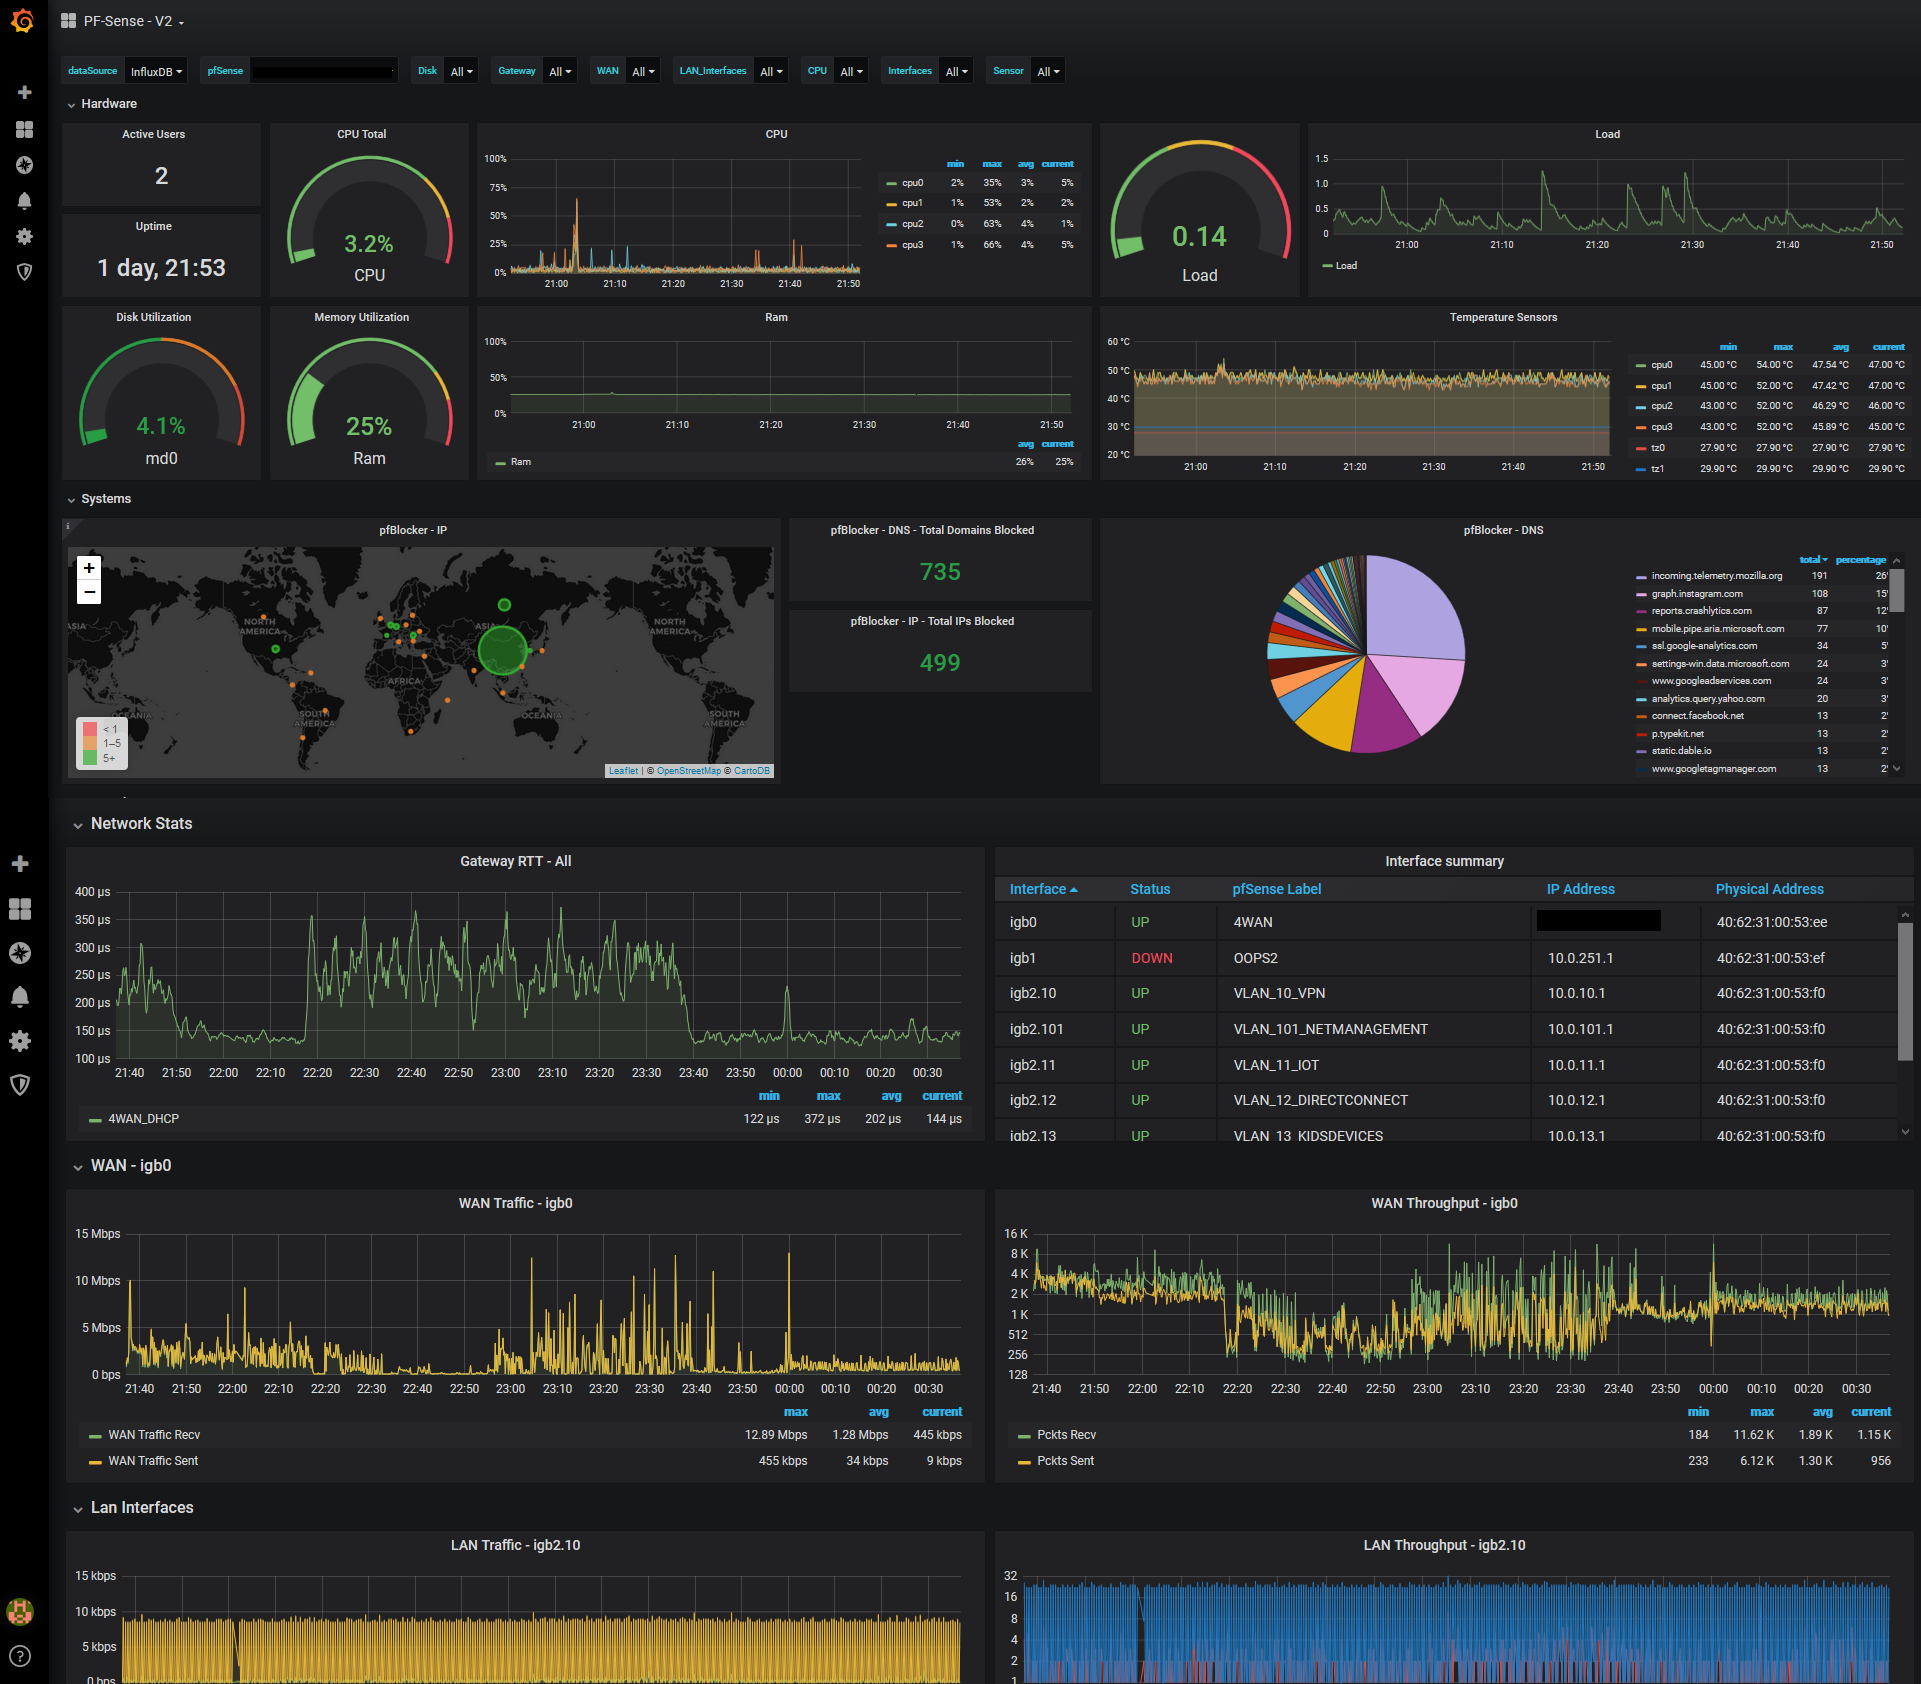
- Active Users
- Uptime
- CPU Load total
- Disk Utilization
- Memory Utilization
- CPU Utilization per core (Single Graph)
- Ram Utilization time graph
- Load Average
- Load Average Graph
- CPU and ACPI Temperature Sensors
- pfBlocker IP Stats
- pfBlocker DNS Stats
- Gateway Response time - dpinger
- List of interfaces with IP, MAC, Status and pfSesnse labels thanks to /u/trumee
- WAN Statistics - Traffic & Throughput (Identified by dashboard variable)
- LAN Statistics - Traffic & Throughput (Identified by dashboard variable)
- Unbound stats - Plugin and config included and working but not implemented
The Config for the dashboard relies on the variables defined within the dashboard in Grafana. When importing the dashboard, make sure to select your datasource.
Dashboard Settings -> Variables
WAN - $WAN is a static variable defined so that a separate dashboard panel can be created for WAN interfaces stats. Use a comma-separated list for multiple WAN interfaces.
LAN_Interfaces - $LAN_Interfaces uses a regex to remove any interfaces you don't want to be grouped as LAN. The filtering happens in the "Regex" field. I use a negative lookahead regex to match the interfaces I want excluded. It should be pretty easy to understand what you need to do here. I have excluded igb0 (WAN) and igb2 (only used to host vlans).
After writing this up, I realize I need to change this variable name, it's just not going to happen right now.
In the /config directory you will find all of the additional telegraf config. In pfSense, under Services -> Teltegraf, at the bottom of the page with the teeny tiny text box is where you paste in the included config.
I also included the config for Unbound DNS and it's commented out. I'm not currently using it, but it's fully functional, just uncomment if you want to use it.
I put all my plugins in /usr/local/bin and set them to 555
To troubleshoot plugins, add the following lines to the agent block in /usr/local/etc/telegraf.conf and send a HUP to the telegraf pid.
debug = true
quiet = false
logfile = "/var/log/telegraf/telegraf.log"
I also included a wrapper script for Unbound DNS. I'm not currently using it, but it's fully functional.
Grafana 6.7.1
Influxdb 1.7.10
I was going to post this in the thread made by /u/seb6596 since this is based on their dashboard, but I made quite a few changes and wanted to include information that would get lost in the thread.
What I updated:
- Created dashboard wide variables to make the dashboard more portable and easily configurable. You shouldn't need to update any of the queries.
- Took some inspiration and panels from this dashboard
- Included gateway RTT from dpinger thanks to this integration
- Used telegraf configs from this post by /u/PeskyWarrior
- Tag, templating - No need to specify all cpus or interfaces in the graph queries. These values are pulled in with queries.
- Added chart to show all adapters, IP, MAC and Status from here
- Added Temperature data based on feedback from /u/tko1982 - CPU Temp and any other ACPI device that reports temp is now collected and reported
- Include IP and ping methods from /u/seb6596 when they are back online.
- Make it pretty. I've never been good at this part
- Get the RTT calculations right from the dpinger integration. It's in microseconds but for some reason doesn't match the graphs in pfSense when I compare them.
- Figure out if I can show subnet and media speed/duplex for the interfaces
- Use the pfSense labels in the graphs that show network stats - 2 different measurements
