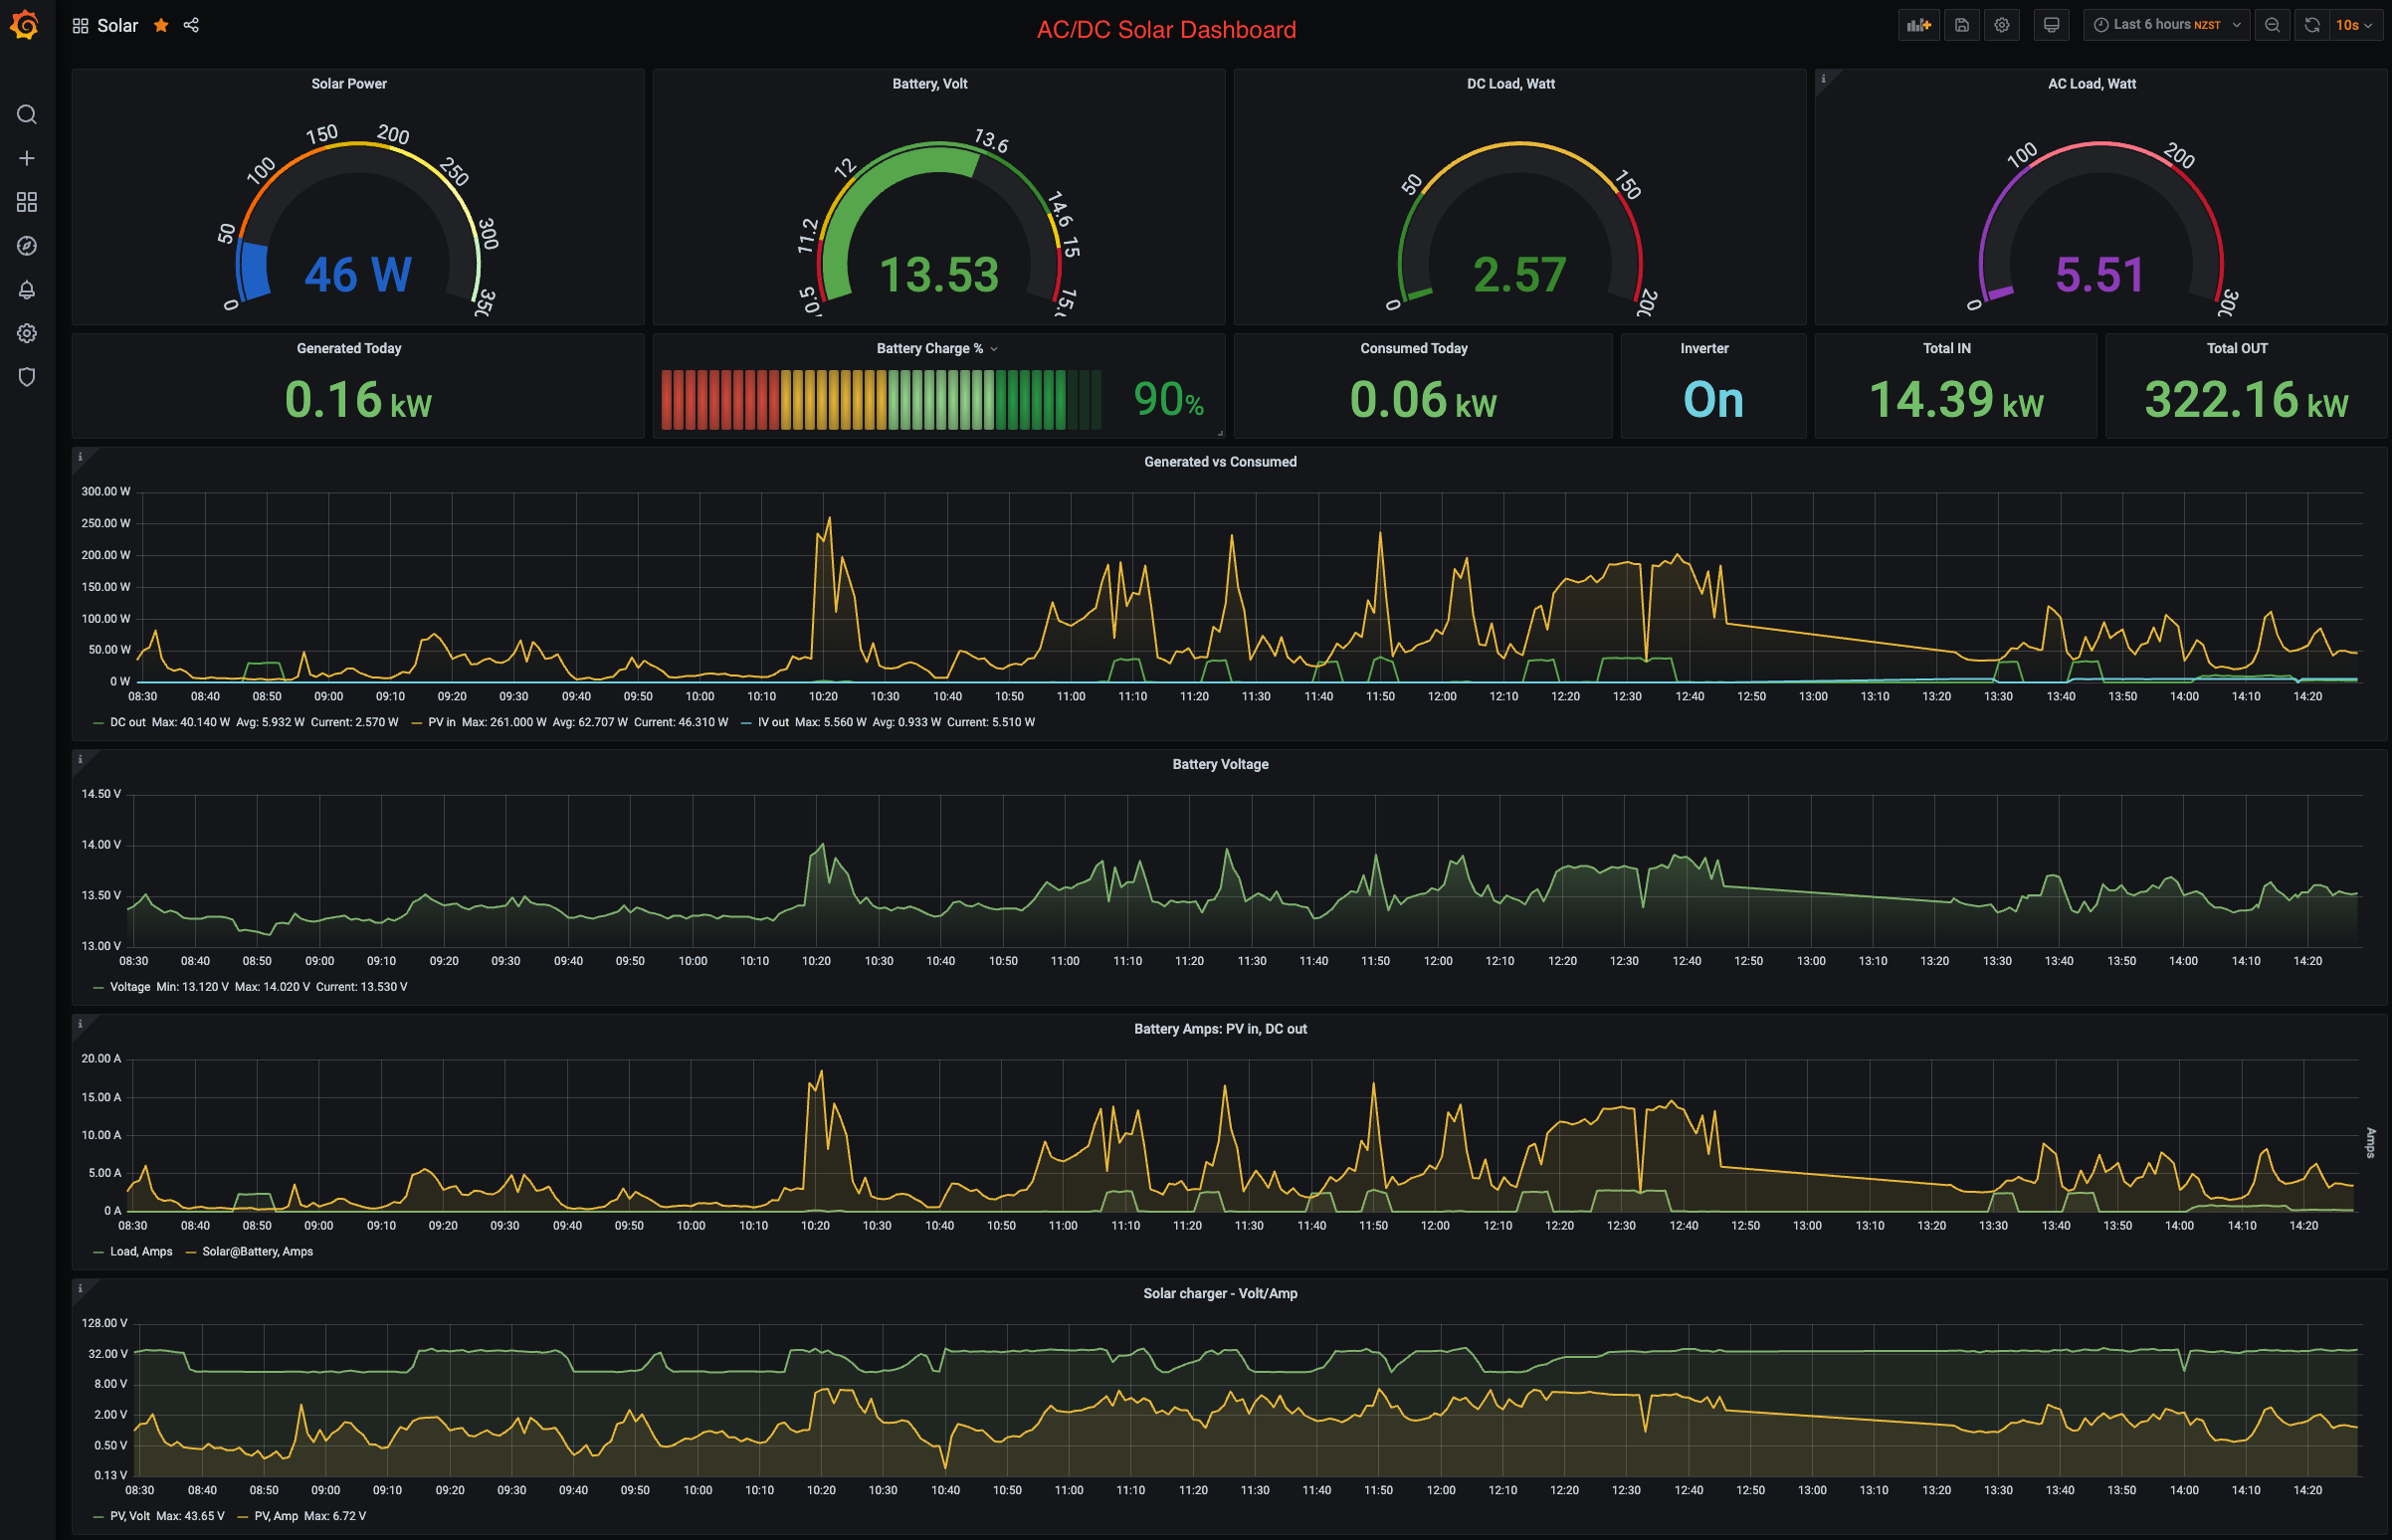
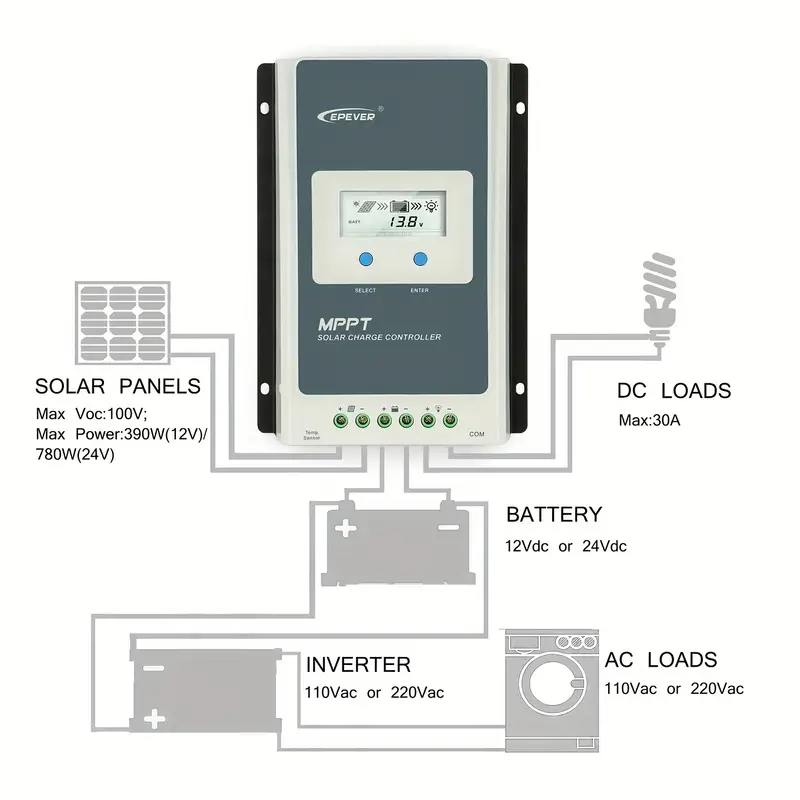
EPSolar Tracer AN/BN devices have been around for a while so this is just another attempt to establish a good monitoring package. This project provides a comprehensive package to configure (set voltages) and query the controller, as well as to display current and statistical values in a timeline using Grafana.
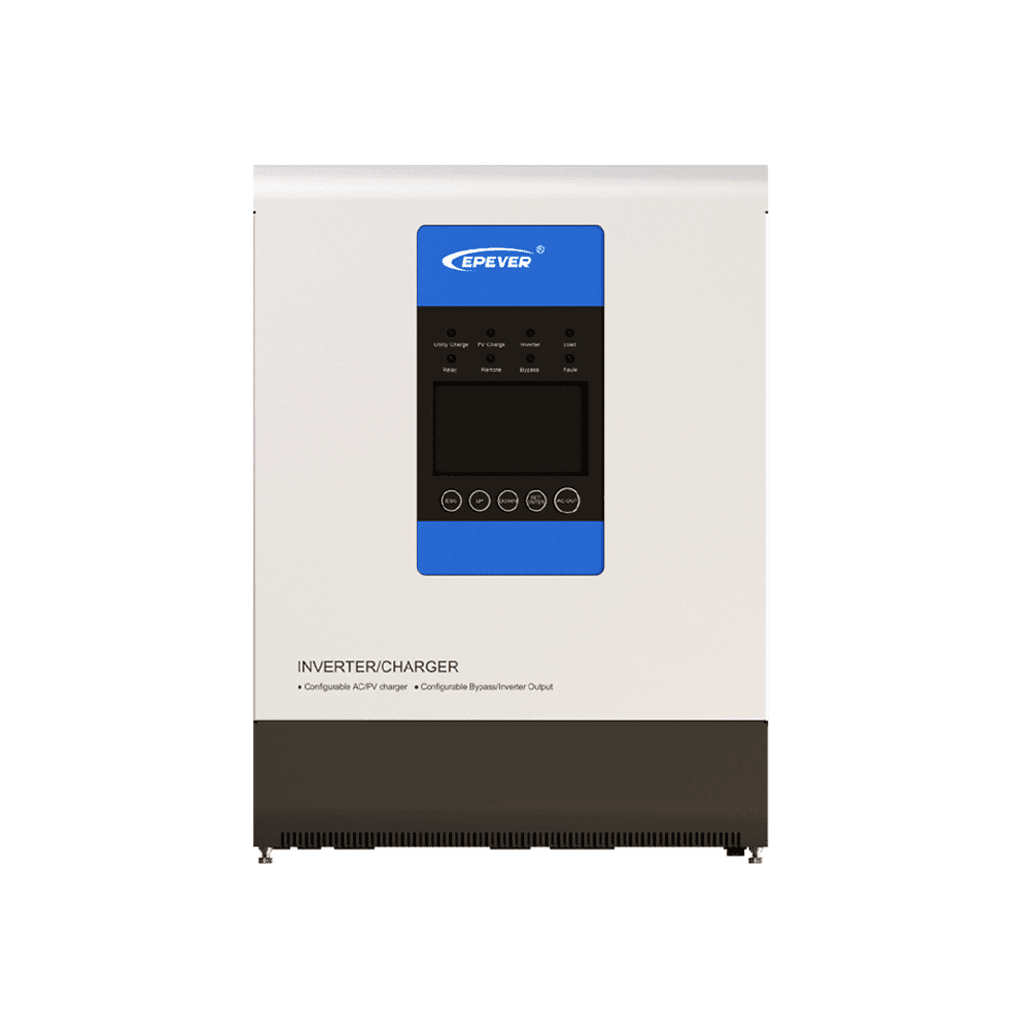
EPSolar UPower hybrid inverters are the more recent addition to EPSOLAR family. They are devices combining MPPT chargers and inverters, and they are great at what they do especially in a semi-off-grid situation where AC power is unreliable. However, it is difficult to get them monitored if you have a Linux machine as they are still uncommon and the protocol is not publicly available.
Out of my communication with EPSolar I managed to obtain the list of registers and develop a UPower Python module for monitoring UPower devices.
- Python 3 (note: UPower scripts are still running 2.7 as I had no chance to test on UPower device recently)
- Influx DB and its Python 3 modules (use pip3 to install)
- Grafana - latest, whatever is availabe in your Raspbian
- To communicate with the devices you will need Minimal Modbus module for Python
- SDM230 device is read using nmakel/sdm_modbus
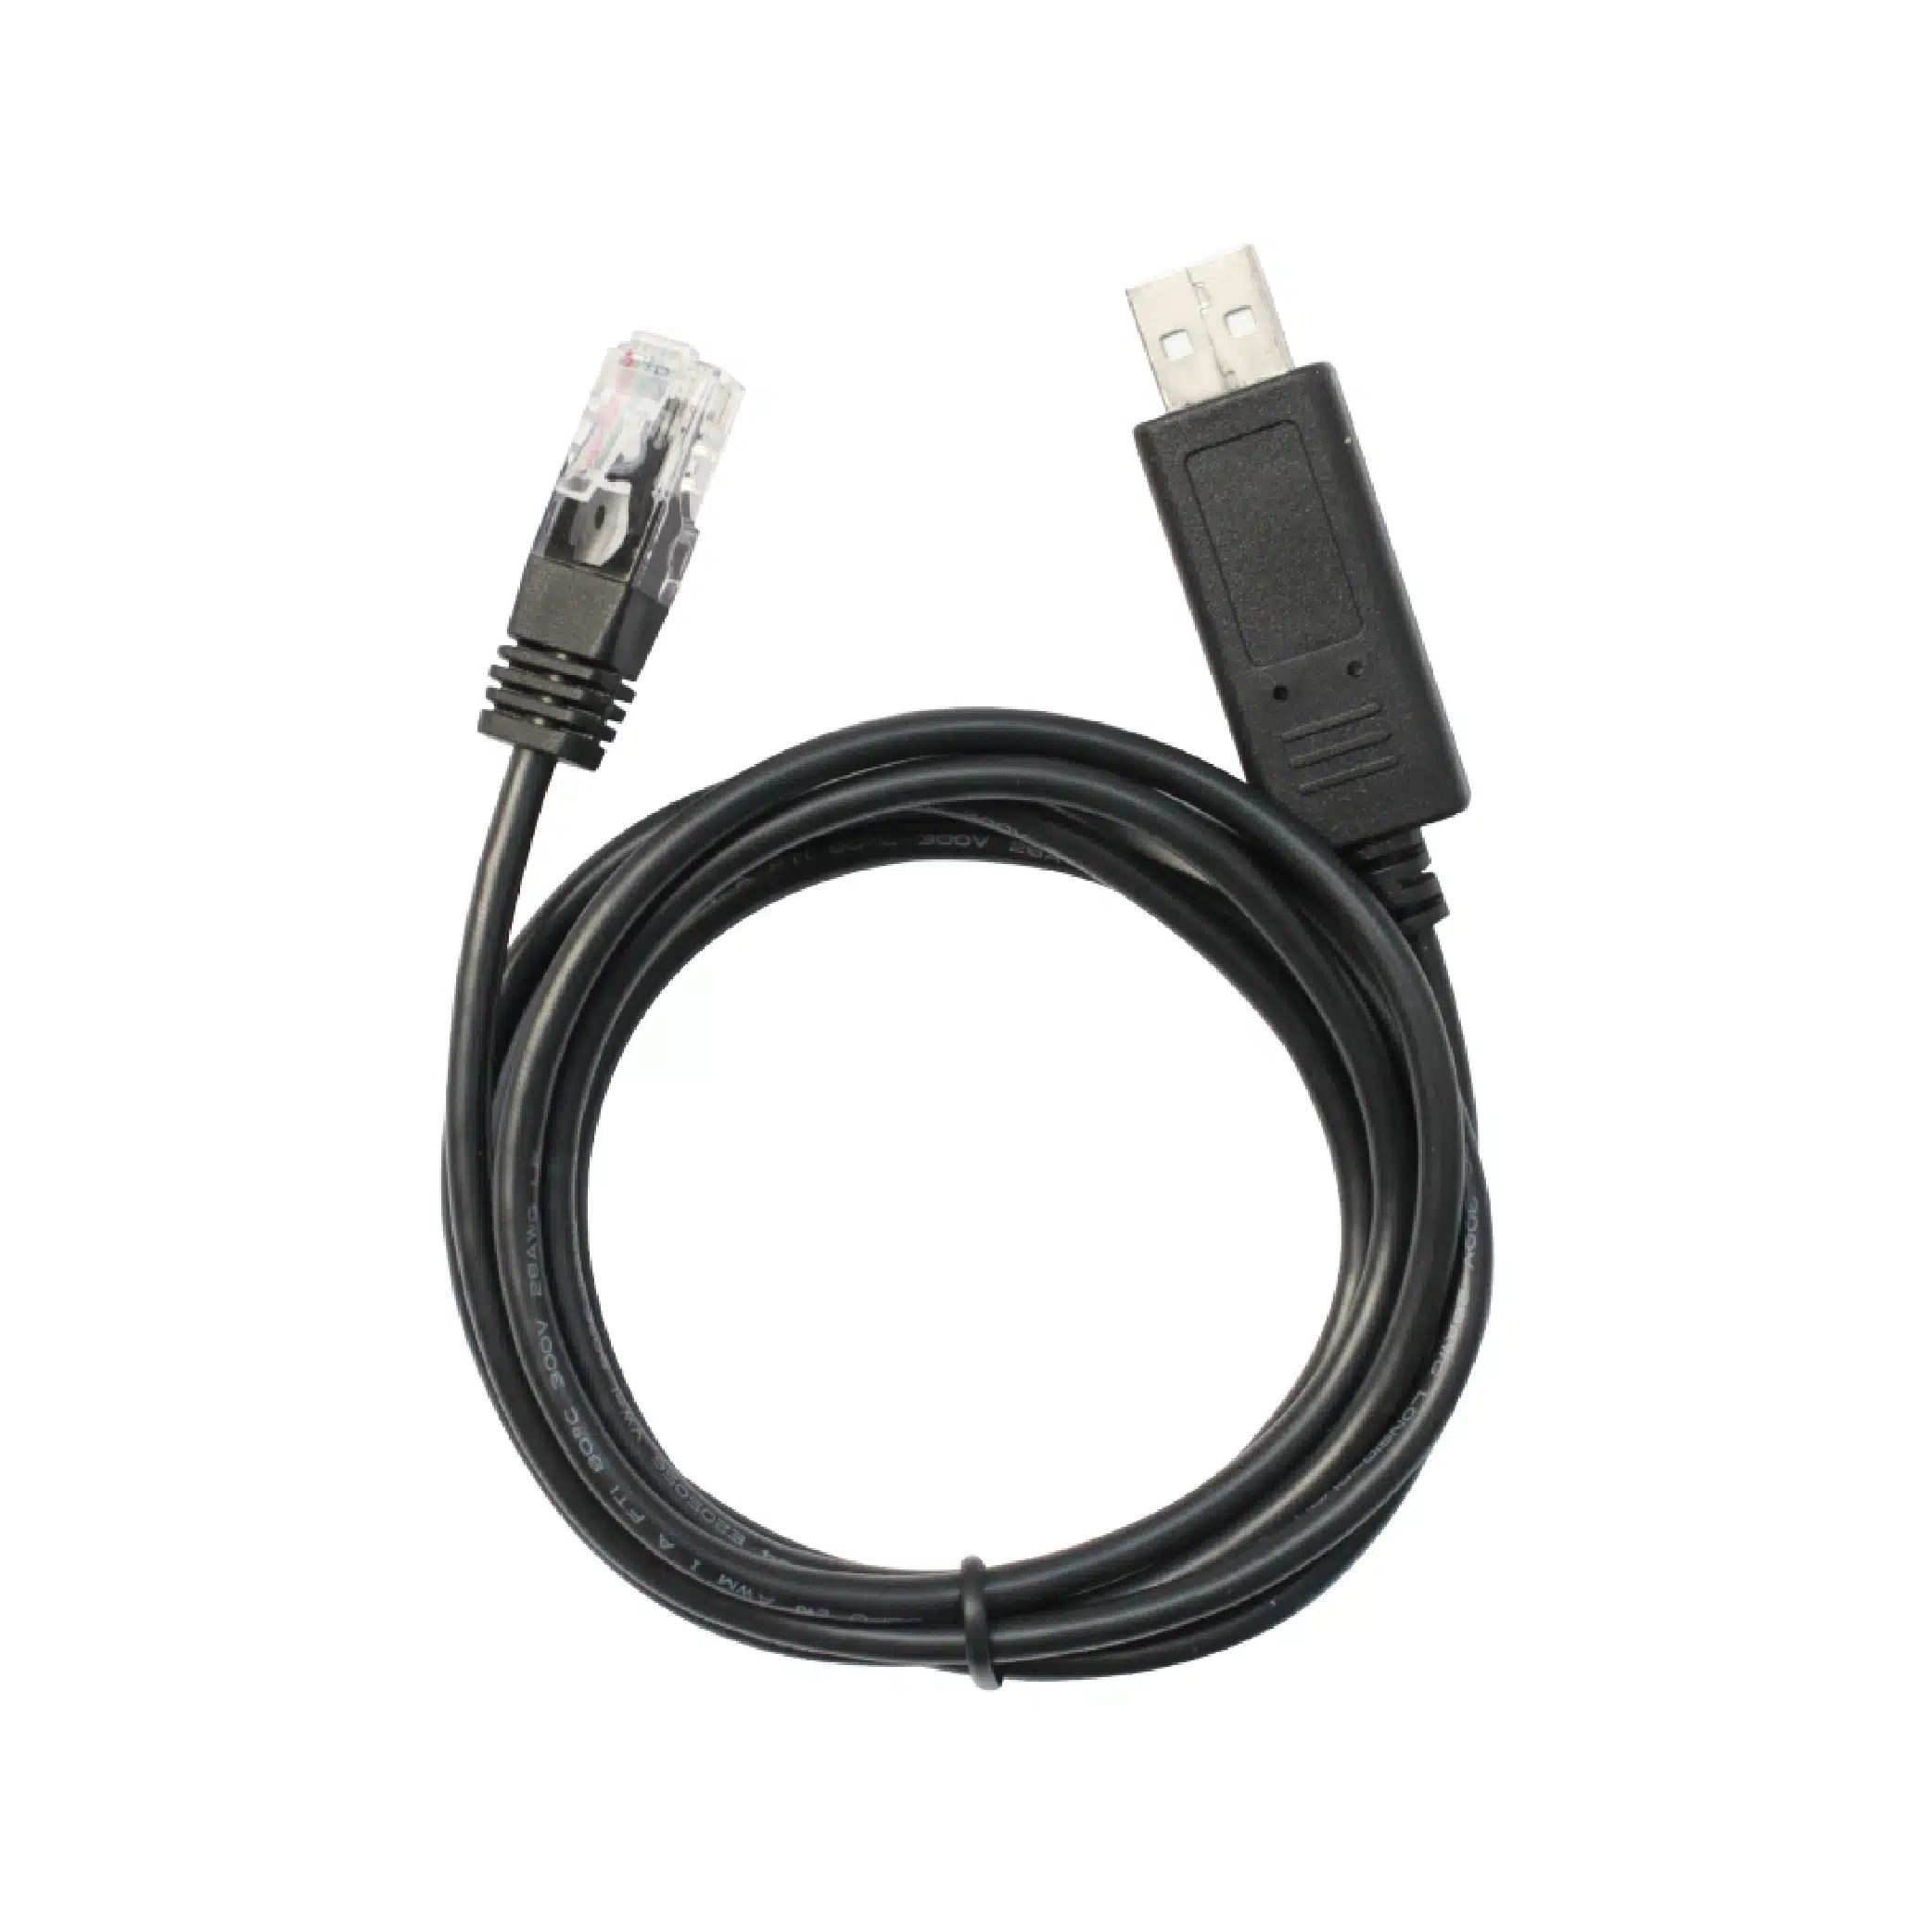
Here it is assumed that you are using the original Epever CC-USB-RS485-150U PC Communication Cable, which requires a Maxlinear Exar Linux driver to work. For other USB-RS485 cables/adaptors refer to their manuals as to what kind of driver do you need.
So, your first step is to install the Exar driver. Run uname -r command to find out which Linux kernel version you are under.
- xr_usb_serial_common-1a directory contains the makefile and instructions that will compile properly on Rasbian OS with Linux kernels up to v3.5.
- xr_usb_serial_common-1a-linux-3.6+ directory has the drive for Linux kernels v3.6 and over.
Before compiling be sure to install the linux headers with
sudo apt-get install raspberrypi-kernel-headers
After installing the headers - do make and sudo make install in the respective driver directory.
The resulting xr_usb_serial_common.ko driver file will be moved to /lib/modules/YOUR_LINUX_KERNEL_VERSION/tty/serial.
Reboot and enjoy!
If all goes well you should see /dev/ttyXRUSB0 when listing ls -la /dev/ttyXR*
If you have more than one Exar USB-RS485 cable plugged in, you will see multiple ttyXRUSB* devices. Make sure you set the right device for your EPever in the configuration. The default is /dev/ttyXRUSB0.
Please note, this project is designed to use ONLY the official Epever CC-USB-RS485-150U Serial USB adapter. The xr_usb_serial driver that comes with this project WILL NOT support any other adapter, you will need to find and install the driver suitable for your adapter yourself.
For instance, I had multiple enquiries from people using QinHeng USB adapter. I suggest talking to @bkuschak who managed to get QinHeng adaptor working by altering the code of the Exar driver provided in this project. Apparently the QinHeng uses another byte order. He might be able to share the altered code for the driver suitable for QinHeng.
Alternatively, you can buy the Epever Exar adapter from the link above, or just search for "CC-USB-RS485-150U" on AliExpress. Their cost averages under $10 USD.
-
Protocol for Epsolar Tracer in this repository
-
Protocol for UPower charger/inverters in this repository
Install minimalmodbus first:
pip install minimalmodbus
SolarTracer.py is the module to communicate with Tracer AN/BN controller
UPower.py is for communication with UPower inverters
The script logtracer.py queries the Tracer AN/BN controller for relevant data and stores into Influx DB.
The script logtracerstats.py queries the Tracer AN/BN controller for Statistical data (such as the energy produced over today, last month, year etc.) and stores it into Influx DB.
The script logupower.py queries the UPower inverter for relevant data and stores into Influx DB.
By default these scripts write the output into the console (as well as the database). Use > /dev/null to make them "silent".
-
First make
logupower.pyorlogtracer.pyorlogsdmtracer.pyandlogtracerstats.pyexecutable:sudo chmod +x log*.py -
Now add the cron job:
crontab -e -
add the line to log the values every minute (this is for the Tracer model, choose another logger that suits you):
* * * * * cd /home/pi/epever-upower-tracer && python3 logtracer.py > /dev/null -
unfortunately, cron does not understand seconds, however you can add another line if you want it ran every half a minute:
* * * * * cd /home/pi/epever-upower-tracer && sleep 30 && python logtracer.py > /dev/null -
if you need the statistical values, such as the energy accumulated/generated today, over last month, year and in total, you must add another logger into cron. This logger DOES NOT have to run every minute. For example, here we have the Statistics logger running every half an hour:
0,30 * * * * cd /home/pi/epever-upower-tracer && ./logtracerstats.py > /dev/null
If your logger is set to run every minute - then expect the relevant graphs being up to a minute out of date. Work out your required update period for yourself and update crontab as necessary.
Note - for Tracer units the default configuration is now stored in a separate file InfluxConf.py. Update the parameters if you use other, non-EPEVER USB adapters for RS-485, or if you want to set up your Influx database with some other parametes, or use an existing Influx database.
Some very basic knowledge of InfluxDB and Grafana is assumed here. Please read the documentation for Grafana and Influx to make sure you understand how things fit together. In essense, InfluxDB stores values taken out of the controller by the Loggers, and Grafana queries the InfluxDB to display these historical values in a format you choose.
 The grafana/ folder contains the dashboard(s) to monitor realtime and historical solar charging data.
The latest one is the AC_DC_SolarDashboard.json which includes the queries for the SDM230 AC meter.
Use this guide to install InfluxDB and Grafana on Raspberry Pi
Run http://raspberrypi.local:3000 (or whatever your name for the Raspberry Pi is) to configure the Grafana console
When you add InfluxDB as a Data Source. Influx DB should be set up with the following parameters:
- user = "grafana"
- pass = "solar"
- db = "solar"
- host = "127.0.0.1"
- port = 8086
At this point you can also import SolarDashboard from grafana/ folder.
Use solar measurement to import the values from when setting up the console for the current data.
The following values are available in the solar measurement when building a Grafana query:
- Generation: voltage, amperage and power -
PVvolt,PVamps,PVwatt - Consumption: voltage, amperage and power -
DCvolt,DCamps,DCwatt - Battery:
BAvolt,BAamps,BAwattrespectively - Additional battery parameters:
BAtemp(if the thermometer is connected),BApercpercentage of charge,BAstatbattery status,BAcurbattery current (could be positive or negative, depending what prevails - generation or consumption)
Use solar_stats measurement for the statistical values. Once you have your Statistical logger running, you will see this additional measurement in your InfluxDB.
These are the values you can select from solar_stats, when you build your Grafana query:
DCkwh2d- DC power consumed todayDCkwhTT- DC power consumed in ToTalDCkwhTY- DC power consumed This YearDCkwhTm- DC power consumed This MonthPVkwh2d- Solar power generated todayPVkwhTT- Solar power generated in ToTalPVkwhTY- Solar power generated This YearPVkwhTm- Solar power generated This Month
getTracerSettings.pyqueries settings of the Tracer AN and displays all current voltage settingssetTracerSettings.pywill rewrite Tracer AN/BN voltages (to support LiFePO4 batteries for example).
Current settings in the script are for 12V LiFePO4 160Ah battery, however the script can be easily modified to set values for 24V and also other types of batteries. There is a pre-filled array for LiFePO4 and a Lead-Acid flooded battery in the script.
See Battery voltage settings in this repository with the default settings from Victron.
See the comments in the script itself show how to choose the battery parameters. For instance,
tracer.setBatterySettings(batteryLiFePO4, 300, 24)
will set your battery to 300Ah 24V LiFePO4, and
tracer.setBatterySettings(batteryLeadAcid, 200, 12)
will set it to 200Ah 12V Lead-Acid battery
ivctl.pymay be used to switch the UPower's internal inverter off/on for the night
Eastron SDM230 is a simple meter that measures AC consumption if you have an external inverter. Connect it between the inverter and the load, and you can have another data stream from your AC devices under the same dashboard.
The sdm239/ directory contains scripts to query the device.
logsdmtracer.py - is the script that queries both Epever Tracer and the SDM 230 and records into InfluxDB
It adds another measurement acpower with the Inverter values such as IVvolt, IVamps, IVwatt and IVison (=1 if the meter is on).


