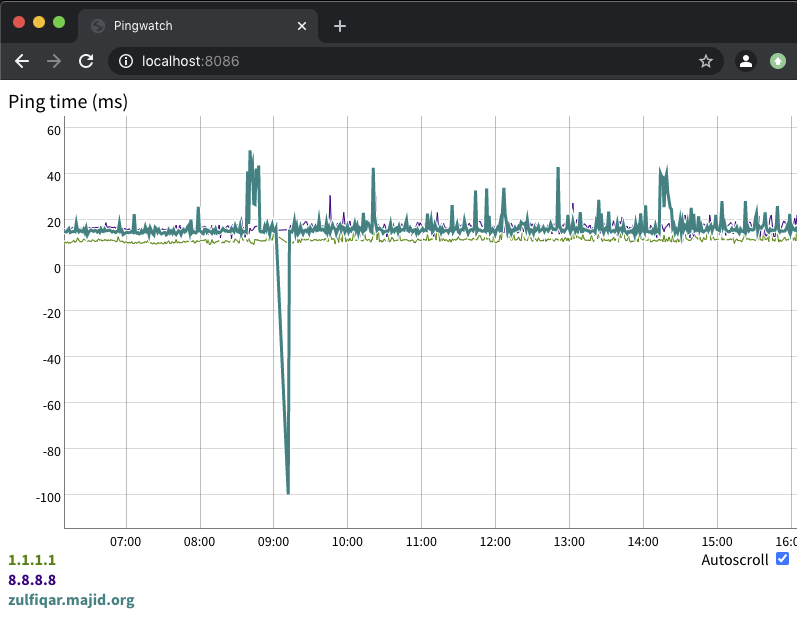
Simple monitoring tool for your Internet connection, pings hosts and reports on availability and trends
Prerequisites:
- Go 1.13 or later
git clone https://github.com/fazalmajid/pingwatch
cd pingwatch
go build
On Linux, run:
sudo setcap cap_net_raw=+ep pingwatch
this allows pingwatch to open raw sockets so it can send ICMP packets.
You can get a list of command-line flags using pingwatch -h
The list of hostnames or IPs to ping is in the table dests.
To add a destination, run:
sqlite3 pingwatch.sqlite << EOF
insert into dests values ('1.1.1.1'), ('8.8.8.8'), ('www.google.com');
EOF
After database is initialized you can add or delete destinations as follows:
To add a destination, run:
pingwatch -add example.com
To remove a destination, run:
pingwatch -del example.com
The actual measurements are in the table pings:
- time timestamp in SQLite julian day format, UTC)
- host hostname that was pinged
- ip IPv4 or IPv6 address host resolved to at ping time
- rtt ping round-trip time in milliseconds. A value of
-3600means the ping timed out
You can use sqlite triggers to automatically clear old entries to keep the database small
This trigger will delete entries from table pings which are older than 1 day:
sqlite3 pingwatch.sqlite << EOF
CREATE TRIGGER clean1day AFTER INSERT ON pings
BEGIN
	DELETE FROM pings WHERE pings.time < julianday('now', '-1 day');
END
EOF
Refer to the julianday() function manual for details
The web user interface can be accessed at http://localhost:8086/ by default (or change it using the -p flag).
By convention, a ping time of -100ms means timeout, so downtime can stand out in the graph. In the SQLite database, this is stored as -3600e3
You can zoom in by selecting a time range, scroll using by pressing Shift while moving the mouse or zoom out back to the original view by double-clicking (graphs are courtesy of the awesome Dygraphs library).
The default date range for the graph is 14 days, but you can change that:
pingwatch -days 7to show only the last 7 dayspingwatch -display 6hto display only the last 6 hours
