PWR: Piecewise Regression (PWR) for time series (or structured longitudinal data) modeling and optimal segmentation by using optimized dynamic programming.
You can install the PWR package from GitHub with:
# install.packages("devtools")
devtools::install_github("fchamroukhi/PWR_R")
To build vignettes for examples of usage, type the command below instead:
# install.packages("devtools")
devtools::install_github("fchamroukhi/PWR_R",
                         build_opts = c("--no-resave-data", "--no-manual"),
                         build_vignettes = TRUE)
Use the following command to display vignettes:
browseVignettes("PWR")library(PWR)# Application to a toy data set
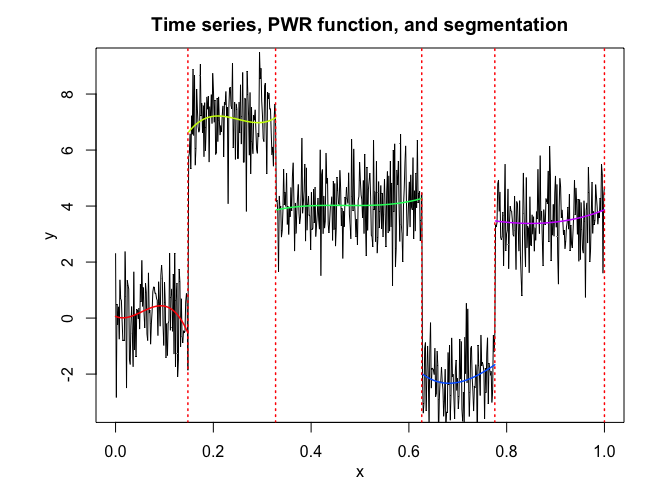
data("toydataset")
x <- toydataset$x
y <- toydataset$y
K <- 5 # Number of segments
p <- 3 # Polynomial degree
pwr <- fitPWRFisher(X = x, Y = y, K, p)
pwr$summary()
#> --------------------
#> Fitted PWR model
#> --------------------
#>
#> PWR model with K = 5 components:
#>
#> Clustering table (Number of observations in each regimes):
#>
#> 1 2 3 4 5
#> 100 120 200 100 150
#>
#> Regression coefficients:
#>
#> Beta(k = 1) Beta(k = 2) Beta(k = 3) Beta(k = 4) Beta(k = 5)
#> 1 6.106872e-02 -5.450955 -2.776275 122.7045 4.020809
#> X^1 -7.486945e+00 158.922010 43.915969 -482.8929 13.217587
#> X^2 2.942201e+02 -651.540876 -94.269414 609.6493 -33.787416
#> X^3 -1.828308e+03 866.675017 67.247141 -249.8667 20.412380
#>
#> Variances:
#>
#> Sigma2(k = 1) Sigma2(k = 2) Sigma2(k = 3) Sigma2(k = 4) Sigma2(k = 5)
#> 1.220624 1.110193 1.079366 0.9779733 1.028329
pwr$plot()# Application to a real data set
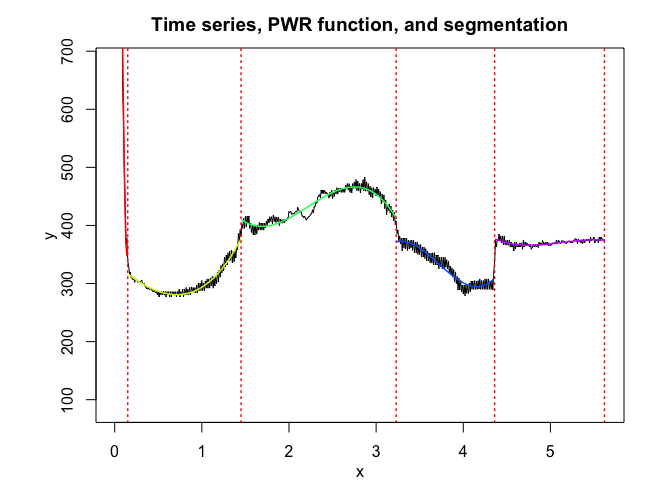
data("realdataset")
x <- realdataset$x
y <- realdataset$y2
K <- 5 # Number of segments
p <- 3 # Polynomial degree
pwr <- fitPWRFisher(X = x, Y = y, K, p)
pwr$summary()
#> --------------------
#> Fitted PWR model
#> --------------------
#>
#> PWR model with K = 5 components:
#>
#> Clustering table (Number of observations in each regimes):
#>
#> 1 2 3 4 5
#> 15 130 178 113 126
#>
#> Regression coefficients:
#>
#> Beta(k = 1) Beta(k = 2) Beta(k = 3) Beta(k = 4) Beta(k = 5)
#> 1 2163.323 334.23747 1458.6530 -11445.9003 6418.36449
#> X^1 -13244.753 -125.04633 -1578.1793 9765.9713 -3572.38535
#> X^2 -86993.374 35.33532 753.8468 -2660.5976 699.64809
#> X^3 635558.069 49.12683 -113.1589 238.3246 -45.43516
#>
#> Variances:
#>
#> Sigma2(k = 1) Sigma2(k = 2) Sigma2(k = 3) Sigma2(k = 4) Sigma2(k = 5)
#> 9326.335 50.71573 75.23989 110.6818 15.66317
pwr$plot()


