TMoE (t Mixture-of-Experts) provides a flexible and robust modelling framework for heterogenous data with possibly heavy-tailed distributions and corrupted by atypical observations. TMoE consists of a mixture of K t expert regressors network (of degree p) gated by a softmax gating network (of degree q) and is represented by:
- The gating network parameters
alpha’s of the softmax net. - The experts network parameters: The location parameters (regression
coefficients)
beta’s, scale parameterssigma’s, and the degree of freedom (robustness) parametersnu’s. TMoE thus generalises mixtures of (normal, t, and) distributions and mixtures of regressions with these distributions. For example, when (q=0), we retrieve mixtures of (t-, or normal) regressions, and when both (p=0) and (q=0), it is a mixture of (t-, or normal) distributions. It also reduces to the standard (normal, t) distribution when we only use a single expert ((K=1)).
Model estimation/learning is performed by a dedicated expectation conditional maximization (ECM) algorithm by maximizing the observed data log-likelihood. We provide simulated examples to illustrate the use of the model in model-based clustering of heterogeneous regression data and in fitting non-linear regression functions.
You can install the development version of tMoE from GitHub with:
# install.packages("devtools")
devtools::install_github("fchamroukhi/tMoE")
To build vignettes for examples of usage, type the command below instead:
# install.packages("devtools")
devtools::install_github("fchamroukhi/tMoE",
                         build_opts = c("--no-resave-data", "--no-manual"),
                         build_vignettes = TRUE)
Use the following command to display vignettes:
browseVignettes("tMoE")library(tMoE)# Application to a simulated data set
n <- 500 # Size of the sample
alphak <- matrix(c(0, 8), ncol = 1) # Parameters of the gating network
betak <- matrix(c(0, -2.5, 0, 2.5), ncol = 2) # Regression coefficients of the experts
sigmak <- c(0.5, 0.5) # Standard deviations of the experts
nuk <- c(5, 7) # Degrees of freedom of the experts network t densities
x <- seq.int(from = -1, to = 1, length.out = n) # Inputs (predictors)
# Generate sample of size n
sample <- sampleUnivTMoE(alphak = alphak, betak = betak,
sigmak = sigmak, nuk = nuk,
x = x)
y <- sample$y
K <- 2 # Number of regressors/experts
p <- 1 # Order of the polynomial regression (regressors/experts)
q <- 1 # Order of the logistic regression (gating network)
tmoe <- emTMoE(X = x, Y = y, K = K, p = p, q = q, verbose = TRUE)
#> EM - tMoE: Iteration: 1 | log-likelihood: -507.928362957919
#> EM - tMoE: Iteration: 2 | log-likelihood: -496.616459751407
#> EM - tMoE: Iteration: 3 | log-likelihood: -495.338057533443
#> EM - tMoE: Iteration: 4 | log-likelihood: -494.87665901798
#> EM - tMoE: Iteration: 5 | log-likelihood: -494.540436405711
#> EM - tMoE: Iteration: 6 | log-likelihood: -494.260884719921
#> EM - tMoE: Iteration: 7 | log-likelihood: -494.028559169549
#> EM - tMoE: Iteration: 8 | log-likelihood: -493.838442870077
#> EM - tMoE: Iteration: 9 | log-likelihood: -493.685148294063
#> EM - tMoE: Iteration: 10 | log-likelihood: -493.563063681606
#> EM - tMoE: Iteration: 11 | log-likelihood: -493.466798391512
#> EM - tMoE: Iteration: 12 | log-likelihood: -493.391472407013
#> EM - tMoE: Iteration: 13 | log-likelihood: -493.332850725223
#> EM - tMoE: Iteration: 14 | log-likelihood: -493.287369975896
#> EM - tMoE: Iteration: 15 | log-likelihood: -493.252100316603
#> EM - tMoE: Iteration: 16 | log-likelihood: -493.22467655087
#> EM - tMoE: Iteration: 17 | log-likelihood: -493.203230250478
#> EM - tMoE: Iteration: 18 | log-likelihood: -493.186308225785
#> EM - tMoE: Iteration: 19 | log-likelihood: -493.172706219166
#> EM - tMoE: Iteration: 20 | log-likelihood: -493.161526034733
#> EM - tMoE: Iteration: 21 | log-likelihood: -493.152172688251
#> EM - tMoE: Iteration: 22 | log-likelihood: -493.144033992847
#> EM - tMoE: Iteration: 23 | log-likelihood: -493.136717342691
#> EM - tMoE: Iteration: 24 | log-likelihood: -493.129943945468
#> EM - tMoE: Iteration: 25 | log-likelihood: -493.123532865153
#> EM - tMoE: Iteration: 26 | log-likelihood: -493.117387797421
#> EM - tMoE: Iteration: 27 | log-likelihood: -493.111482777337
#> EM - tMoE: Iteration: 28 | log-likelihood: -493.105843922753
#> EM - tMoE: Iteration: 29 | log-likelihood: -493.100527041868
#> EM - tMoE: Iteration: 30 | log-likelihood: -493.095594424752
#> EM - tMoE: Iteration: 31 | log-likelihood: -493.091095987998
#> EM - tMoE: Iteration: 32 | log-likelihood: -493.087058604732
#> EM - tMoE: Iteration: 33 | log-likelihood: -493.083484032917
#> EM - tMoE: Iteration: 34 | log-likelihood: -493.080352933777
#> EM - tMoE: Iteration: 35 | log-likelihood: -493.077631561476
#> EM - tMoE: Iteration: 36 | log-likelihood: -493.075278455602
#> EM - tMoE: Iteration: 37 | log-likelihood: -493.07324975642
#> EM - tMoE: Iteration: 38 | log-likelihood: -493.071502796451
#> EM - tMoE: Iteration: 39 | log-likelihood: -493.069998180986
#> EM - tMoE: Iteration: 40 | log-likelihood: -493.068700757997
#> EM - tMoE: Iteration: 41 | log-likelihood: -493.067579865647
#> EM - tMoE: Iteration: 42 | log-likelihood: -493.066609158996
#> EM - tMoE: Iteration: 43 | log-likelihood: -493.065766222905
#> EM - tMoE: Iteration: 44 | log-likelihood: -493.065032101059
#> EM - tMoE: Iteration: 45 | log-likelihood: -493.064390816246
#> EM - tMoE: Iteration: 46 | log-likelihood: -493.063828921376
#> EM - tMoE: Iteration: 47 | log-likelihood: -493.063335098862
#> EM - tMoE: Iteration: 48 | log-likelihood: -493.062899813509
tmoe$summary()
#> -------------------------------------
#> Fitted t Mixture-of-Experts model
#> -------------------------------------
#>
#> tMoE model with K = 2 experts:
#>
#> log-likelihood df AIC BIC ICL
#> -493.0629 10 -503.0629 -524.1359 -525.154
#>
#> Clustering table (Number of observations in each expert):
#>
#> 1 2
#> 249 251
#>
#> Regression coefficients:
#>
#> Beta(k = 1) Beta(k = 2)
#> 1 0.08674103 0.1446643
#> X^1 2.48588510 -2.7119949
#>
#> Variances:
#>
#> Sigma2(k = 1) Sigma2(k = 2)
#> 0.2531752 0.3249455
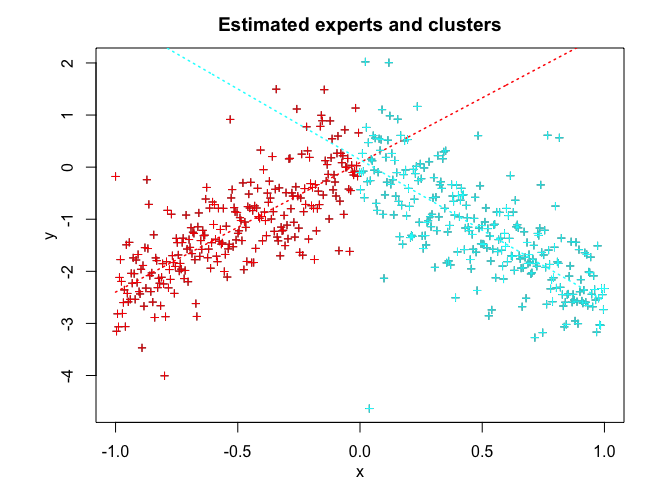
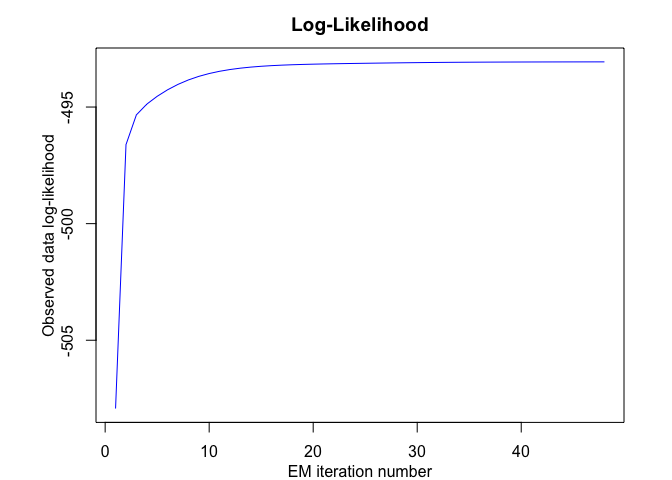
tmoe$plot()# Application to a real data set
library(MASS)
data("mcycle")
x <- mcycle$times
y <- mcycle$accel
K <- 4 # Number of regressors/experts
p <- 2 # Order of the polynomial regression (regressors/experts)
q <- 1 # Order of the logistic regression (gating network)
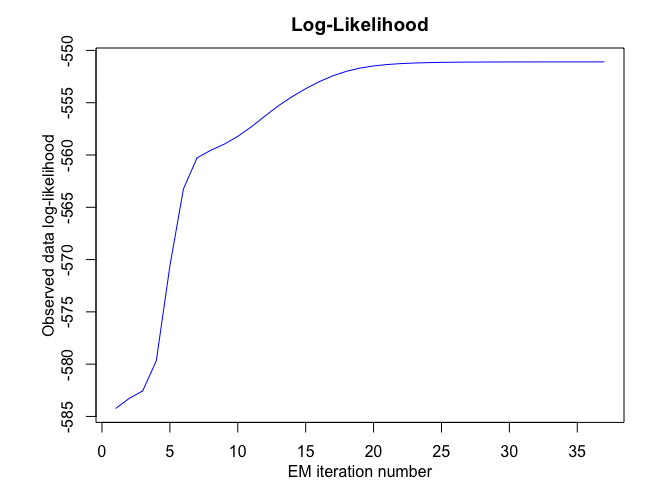
tmoe <- emTMoE(X = x, Y = y, K = K, p = p, q = q, verbose = TRUE)
#> EM - tMoE: Iteration: 1 | log-likelihood: -584.244551006939
#> EM - tMoE: Iteration: 2 | log-likelihood: -583.280585053327
#> EM - tMoE: Iteration: 3 | log-likelihood: -582.557277699991
#> EM - tMoE: Iteration: 4 | log-likelihood: -579.684600371645
#> EM - tMoE: Iteration: 5 | log-likelihood: -570.615713035833
#> EM - tMoE: Iteration: 6 | log-likelihood: -563.236929636529
#> EM - tMoE: Iteration: 7 | log-likelihood: -560.272130663352
#> EM - tMoE: Iteration: 8 | log-likelihood: -559.560569040992
#> EM - tMoE: Iteration: 9 | log-likelihood: -558.966547963314
#> EM - tMoE: Iteration: 10 | log-likelihood: -558.220009630403
#> EM - tMoE: Iteration: 11 | log-likelihood: -557.308586076979
#> EM - tMoE: Iteration: 12 | log-likelihood: -556.278615089687
#> EM - tMoE: Iteration: 13 | log-likelihood: -555.284312317758
#> EM - tMoE: Iteration: 14 | log-likelihood: -554.422594896656
#> EM - tMoE: Iteration: 15 | log-likelihood: -553.660145240677
#> EM - tMoE: Iteration: 16 | log-likelihood: -552.986725110468
#> EM - tMoE: Iteration: 17 | log-likelihood: -552.426713217875
#> EM - tMoE: Iteration: 18 | log-likelihood: -551.997394824966
#> EM - tMoE: Iteration: 19 | log-likelihood: -551.691558063471
#> EM - tMoE: Iteration: 20 | log-likelihood: -551.484716815219
#> EM - tMoE: Iteration: 21 | log-likelihood: -551.348917434038
#> EM - tMoE: Iteration: 22 | log-likelihood: -551.260966054648
#> EM - tMoE: Iteration: 23 | log-likelihood: -551.204198326394
#> EM - tMoE: Iteration: 24 | log-likelihood: -551.167472304675
#> EM - tMoE: Iteration: 25 | log-likelihood: -551.143566186338
#> EM - tMoE: Iteration: 26 | log-likelihood: -551.127872679481
#> EM - tMoE: Iteration: 27 | log-likelihood: -551.117463890004
#> EM - tMoE: Iteration: 28 | log-likelihood: -551.110476692798
#> EM - tMoE: Iteration: 29 | log-likelihood: -551.105720811558
#> EM - tMoE: Iteration: 30 | log-likelihood: -551.102431819953
#> EM - tMoE: Iteration: 31 | log-likelihood: -551.10011588253
#> EM - tMoE: Iteration: 32 | log-likelihood: -551.098451963309
#> EM - tMoE: Iteration: 33 | log-likelihood: -551.097229969444
#> EM - tMoE: Iteration: 34 | log-likelihood: -551.096311424809
#> EM - tMoE: Iteration: 35 | log-likelihood: -551.09560433537
#> EM - tMoE: Iteration: 36 | log-likelihood: -551.095047042671
#> EM - tMoE: Iteration: 37 | log-likelihood: -551.094597800858
tmoe$summary()
#> -------------------------------------
#> Fitted t Mixture-of-Experts model
#> -------------------------------------
#>
#> tMoE model with K = 4 experts:
#>
#> log-likelihood df AIC BIC ICL
#> -551.0946 26 -577.0946 -614.6691 -614.6651
#>
#> Clustering table (Number of observations in each expert):
#>
#> 1 2 3 4
#> 28 37 31 37
#>
#> Regression coefficients:
#>
#> Beta(k = 1) Beta(k = 2) Beta(k = 3) Beta(k = 4)
#> 1 -1.036774138 995.335183 -1838.394608 295.2131862
#> X^1 -0.112211948 -104.221689 113.547570 -12.2742814
#> X^2 -0.007645766 2.441534 -1.707552 0.1259613
#>
#> Variances:
#>
#> Sigma2(k = 1) Sigma2(k = 2) Sigma2(k = 3) Sigma2(k = 4)
#> 1.583492 450.3015 538.2972 557.4782
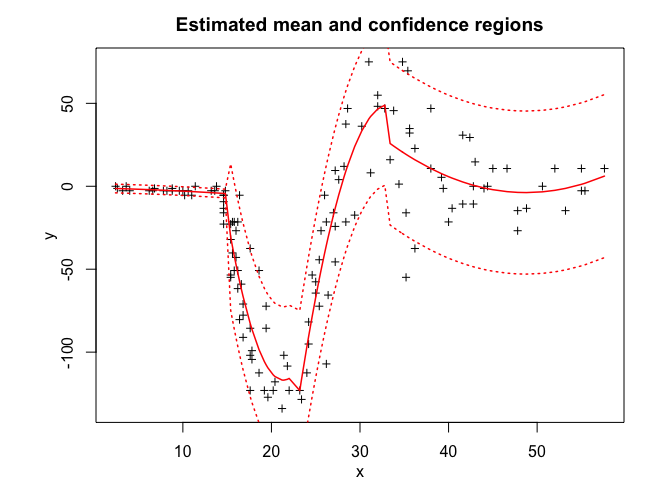
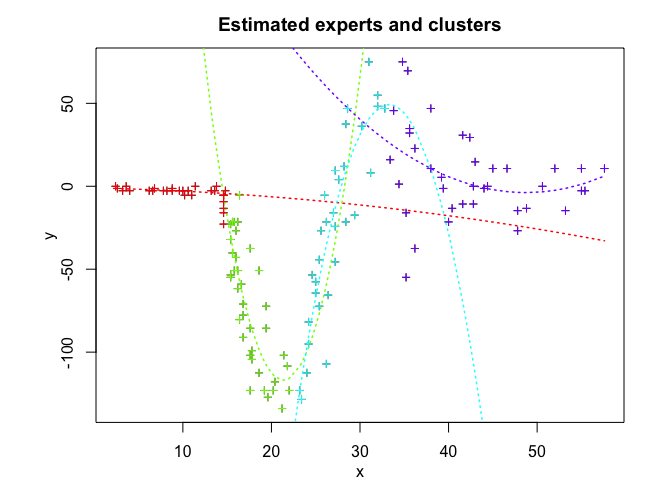
tmoe$plot()

