1 Geographic Data Science Lab, University of Liverpool, Liverpool, United Kingdom
* Correspondence: F.Rowe-Gonzalez@liverpool.ac.uk
This repository contains visualisation of COVID19 trends and patterns. At the moment it contains code for the items below, but there is more to come once I consolidate all of the visualisations that I have created and are dispersed across various places.
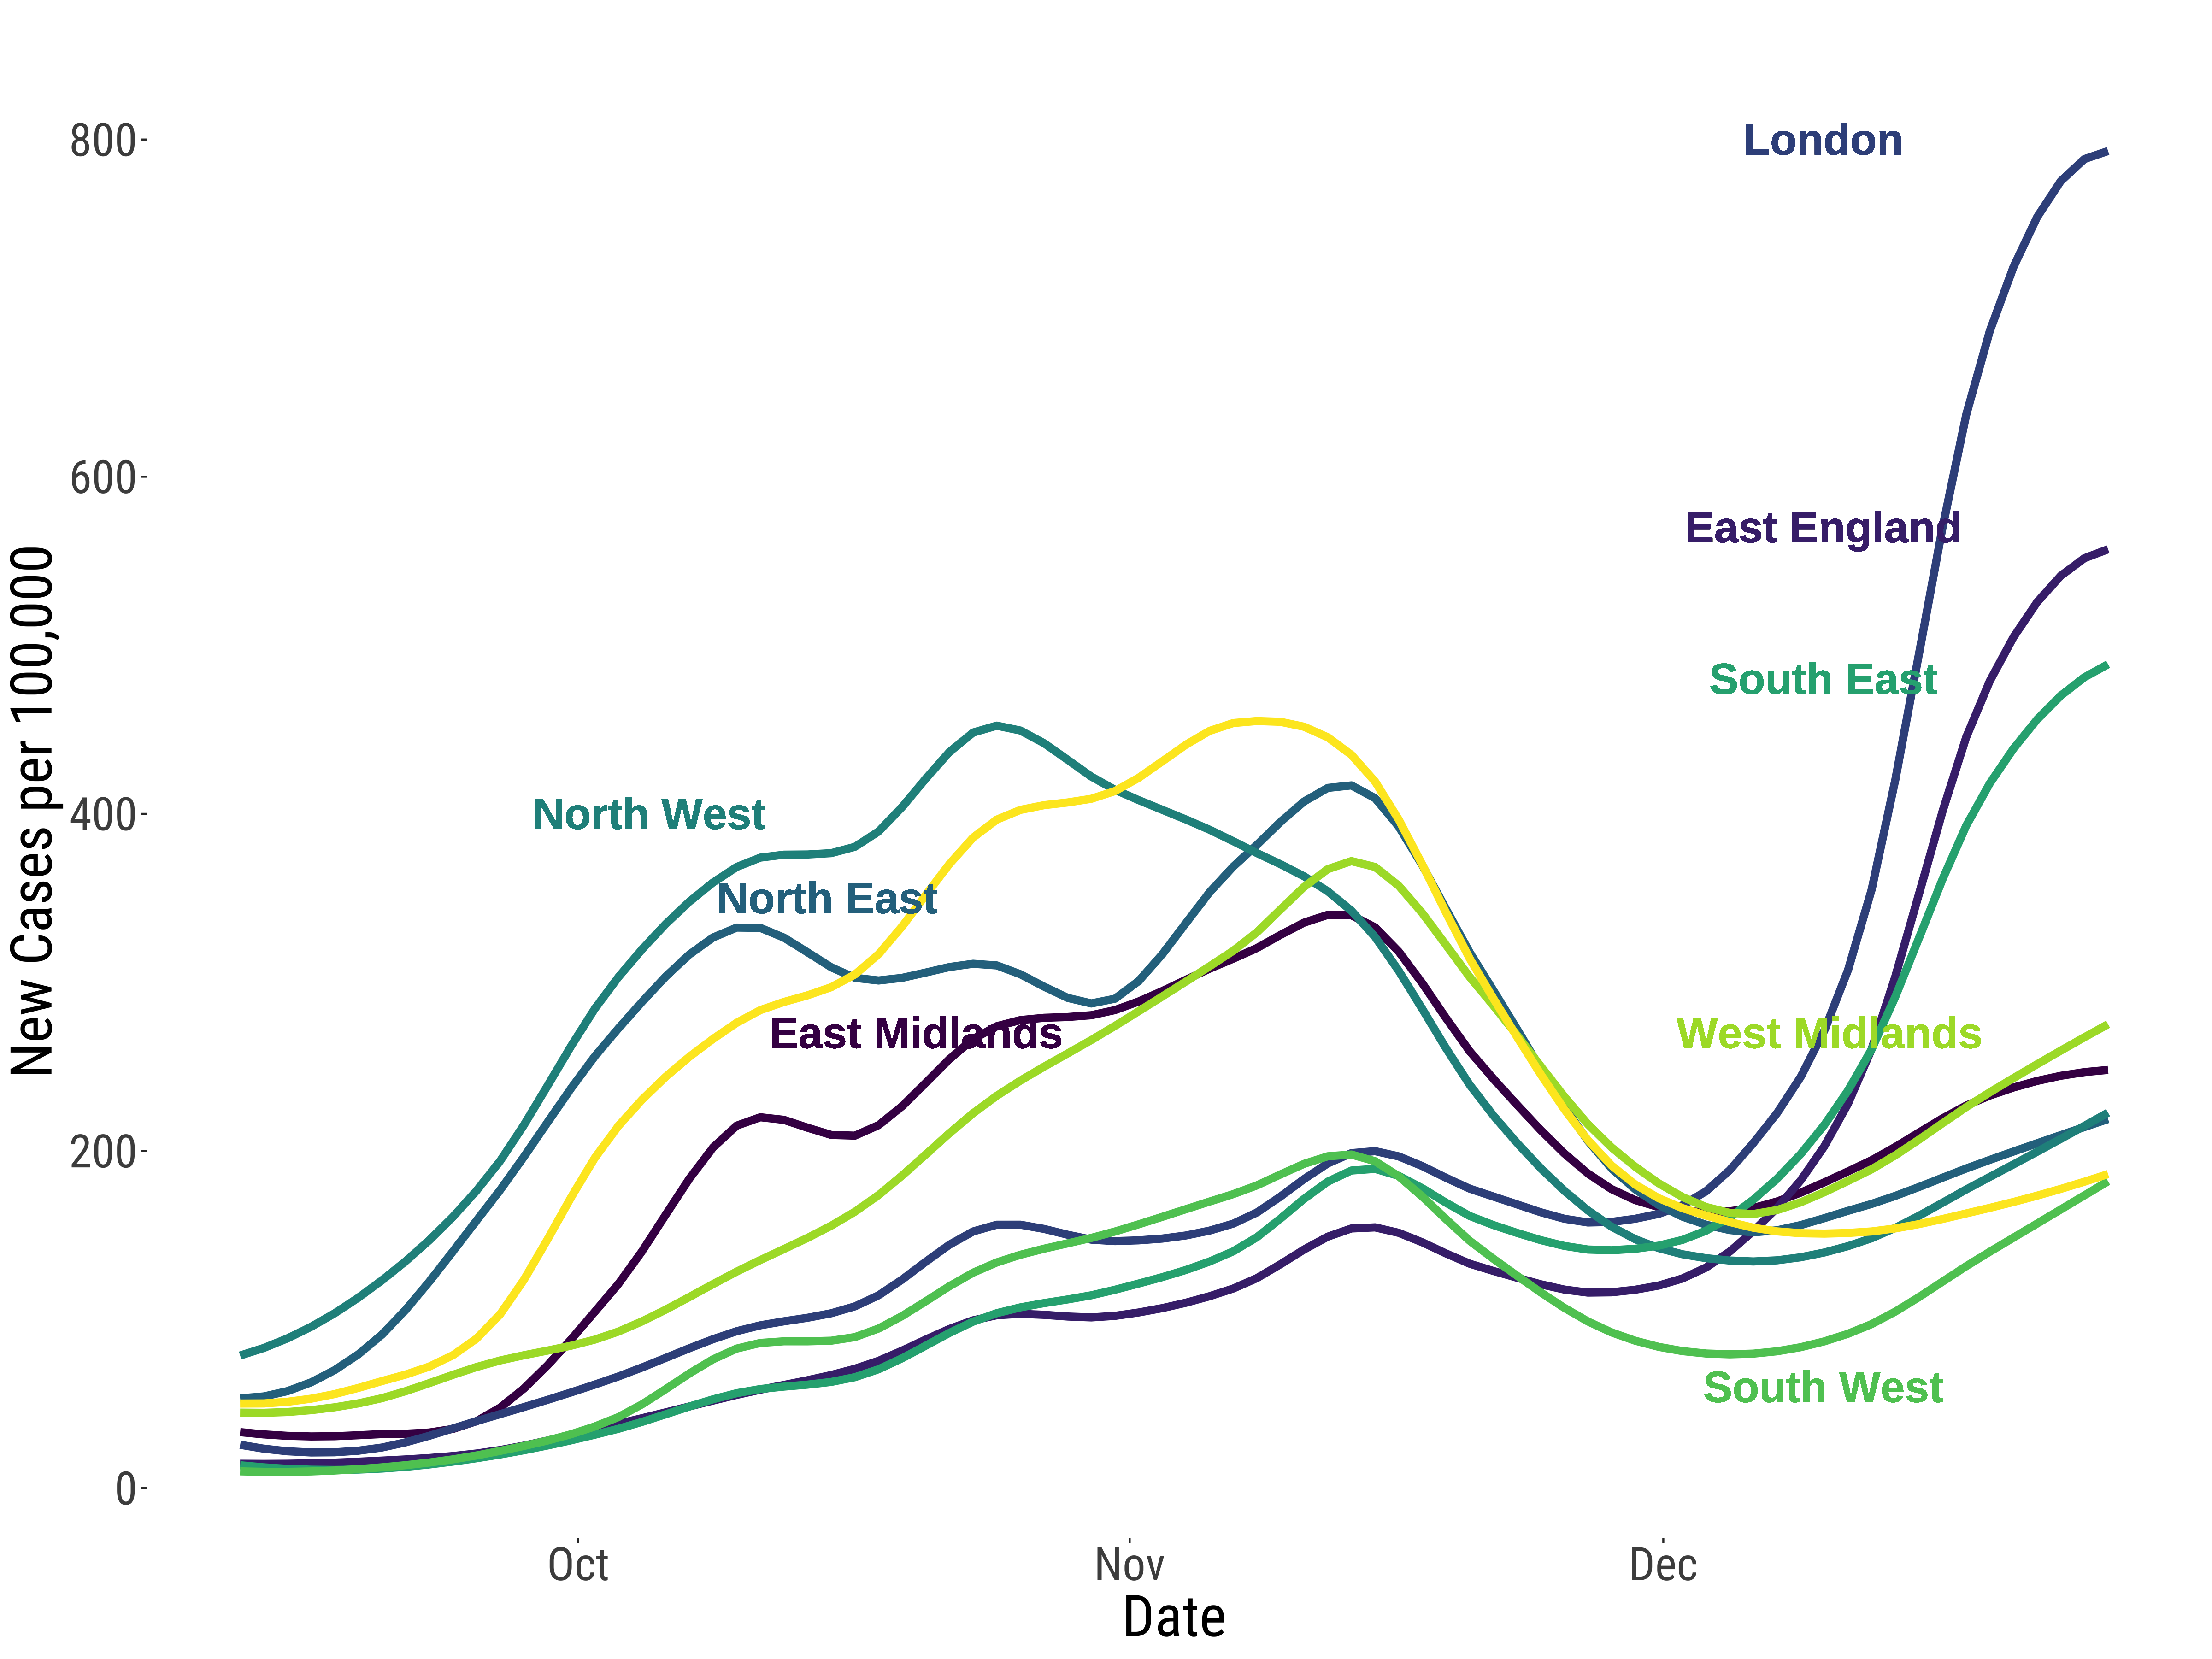
- Time trend plots of Wave 2 by Region
