Methodology overview • Files included • Possible improvements • Credits • License
This approach does not make use of intelligent data analysis and feature extraction. Instead, it aggregates the sales of all colours and sizes and fits a powerful forecasting model to predict the revenue. Nevertheless, this simple method was able to reach rank 31/138. The method is as follows :
-
Load
stock_and_sales_day_0_day_<n>.csv,products.csvandproduct_blocks.csv. Create a denormalised table by adding the sales of all colours and sizes per product per day, and appending the block identifier. Compute the revenue assales x price.date_number product_id block_id sales price revenue 0 0 310130 1726 11 12.95 142.45 1 0 1178388 592 0 49.95 0.00 2 0 1561460 1625 7 29.95 209.65 3 0 1874414 1135 4 25.95 103.80 -
Pivot the previous table to get a new table with shape
(nb_products, nb_days), or aggregate bydate_numberandblock_idto obtain a table with shape(nb_blocks, nb_days).product_id X0 X1 X2 X3 X81 X82 X83 X84 151926 NaN NaN NaN NaN ... 129.75 103.80 51.90 51.90 213413 NaN NaN NaN 59.85 ... 139.65 239.40 279.30 159.60 310130 142.45 168.35 181.3 194.25 ... 25.90 77.70 77.70 64.75 455200 NaN NaN NaN NaN ... 0.00 0.00 0.00 0.00 block_id X0 X1 X2 X3 X81 X82 X83 X84 0 674.60 656.90 403.20 950.40 ... 1827.65 709.05 389.45 888.85 1 29.95 149.75 89.85 179.70 ... 1314.75 1316.60 1105.35 940.45 2 679.40 1228.90 789.25 1138.95 ... 719.25 549.45 359.65 849.15 3 53.91 5.99 41.93 83.86 ... 0.00 0.00 39.95 0.00 -
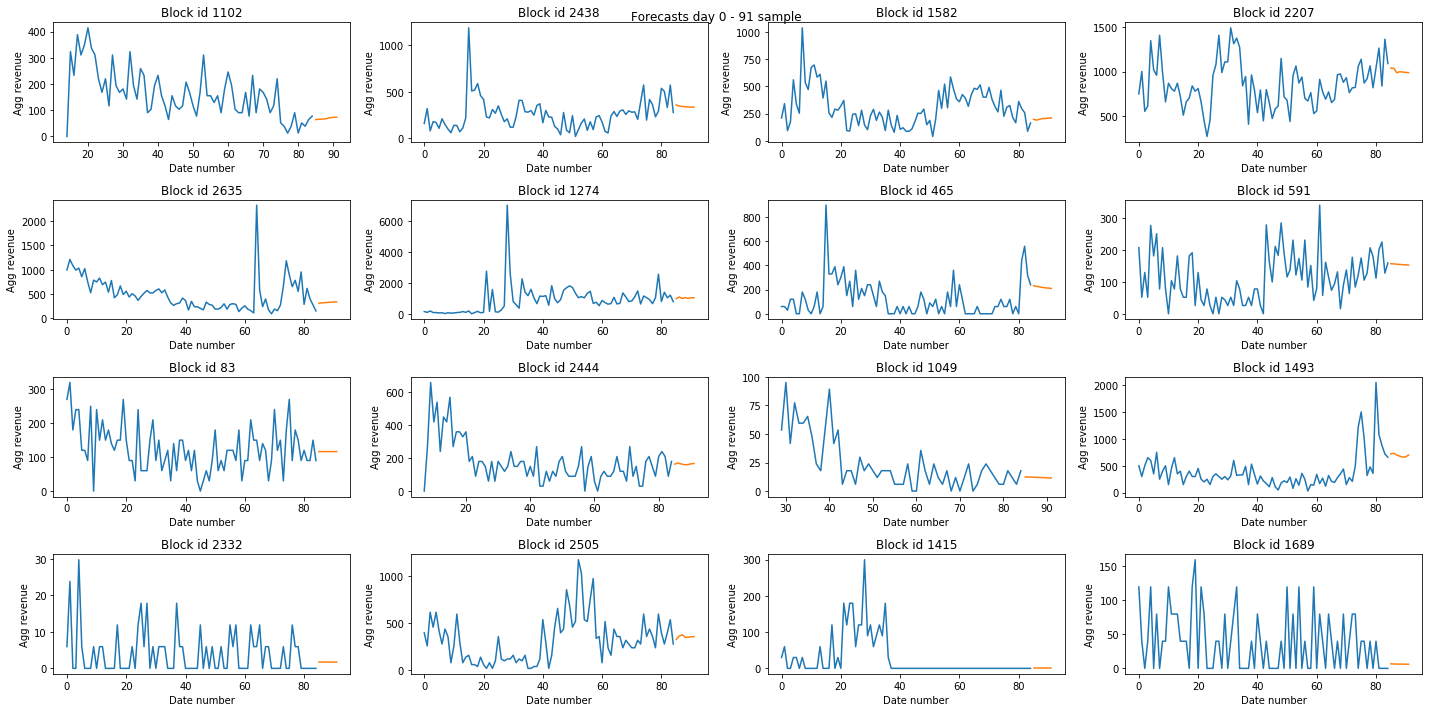
Apply the method proposed by Montero-Manso et al. (2018) in their submission for the M4 competition. This approach combines different statistical forecasting methods. The weights of the combinations are calculated per series using a learning model based on gradient tree boosting exploiting features extracted from the time series as input. Extend the tables in step 2 with the predictions of the model.
block_id X84 Y85 Y86 Y87 Y88 Y89 Y90 Y91 0 ... 888.850 885.58 866.28 858.38 854.33 851.82 850.09 848.85 1 ... 940.450 919.58 891.67 867.34 846.10 827.53 811.28 797.04 2 ... 849.150 681.57 679.75 683.60 680.29 679.35 680.66 678.77 3 ... 0.001 9.86 9.75 9.64 9.53 9.42 9.31 9.20 -
For each
block_id(orproduct_id) in the previous table, add the resulting forecasts to get an estimation of the total revenue for the last week. Make a bet following a particular heuristic, for example, by ranking the blocks according to their predicted revenue and picking from the top of the ranking until the chosen blocks contain 50 products (greedy, not a very good heuristic tho). A better heuristic would take into account the number of products in each block, giving preference to blocks with less number of items.
-
generate_ts_datasets.ipynbpreprocesses the original data to generate a time series dataset of(nb_blocks, nb_days). Each time series represents the revenue over time of a particular block (steps 1 and 2). It can be easily modified to generate the same dataset but for products. -
generate_forecasts.Rapplies the proposed forecasting model to generate predictions for the following week (step 3). -
generate_bets.ipynbuses the previous forecasts to pick a bet (step 4). -
data/preprocessedthe output of step 2 for each day of the competition. -
data/modelthe output of step 3 for each day of the competition. Also the xgboost model trained for the last day.
I have not included the original data. If you want to reproduce my results you must place this data (i.e., the .csv files) in data/raw.
-
Compute additional features from the time series by using the information in the
positions_day_0_day_<n>.csvfile (e.g., the best position of a product across all colours and sizes for each day). -
Improve the heuristic used in
generate_bets.ipynb.
I do not own the code used to generate the forecasts. As I mentioned, I used the method proposed by Montero-Manso et al. (2018) for the M4 competition. You can find the original code at robjhyndman/M4metalearning. I adapted the code for the dataset provided by ZARA.
This project is licensed under the MIT License - see the LICENSE.md file for details.
