Monitor logs, metrics, pings, and traces of your distributed (micro-) services. There are also slides walking you through the features of this repository.
- X-Pack Monitoring: Start the overview page to show the systems we are using for monitoring.
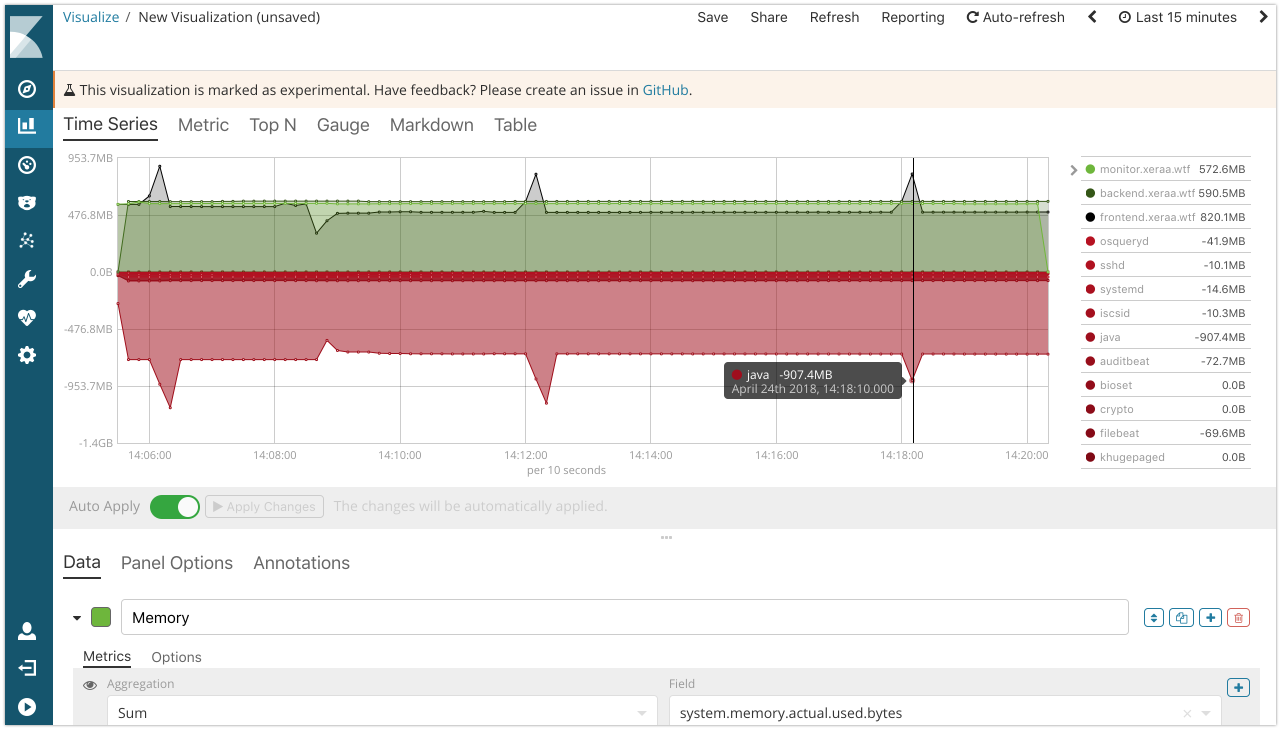
- Metricbeat System: Show the [Metricbeat System] Overview dashboard in Kibana and then switch to [Metricbeat System] Host overview. If you show all hosts, you will see little spikes approximately every 5 minutes — this is a rogue process we are running with a cron job and we want to find it.
- Build an overview with the Time Series Visual Builder:
- A sum over the field
system.memory.actual.used.bytesand group by the termbeat.name. - A sum over the field
system.process.memory.rss.bytesand group by the termsystem.process.name. Optionally move this visualization to the negative axis to make it easier to visualize with a calculation onparams.process*-1(processis your variable name).
- A sum over the field
- Packetbeat: Show the [Packetbeat] Overview, [Packetbeat] Flows, and [Packetbeat] HTTP dashboard, let attendees hit /, /good, /bad, and /foobar a few times, and see the corresponding graphs. Optionally show the [Packetbeat] TLS Sessions and [Packetbeat] DNS Tunneling dashboards as well.
- Filebeat modules: Show the [Filebeat Nginx] Access and error logs, [Filebeat System] Syslog dashboard, [Filebeat System] SSH login attempts, and [Osquery Result] Compliance pack dashboards.
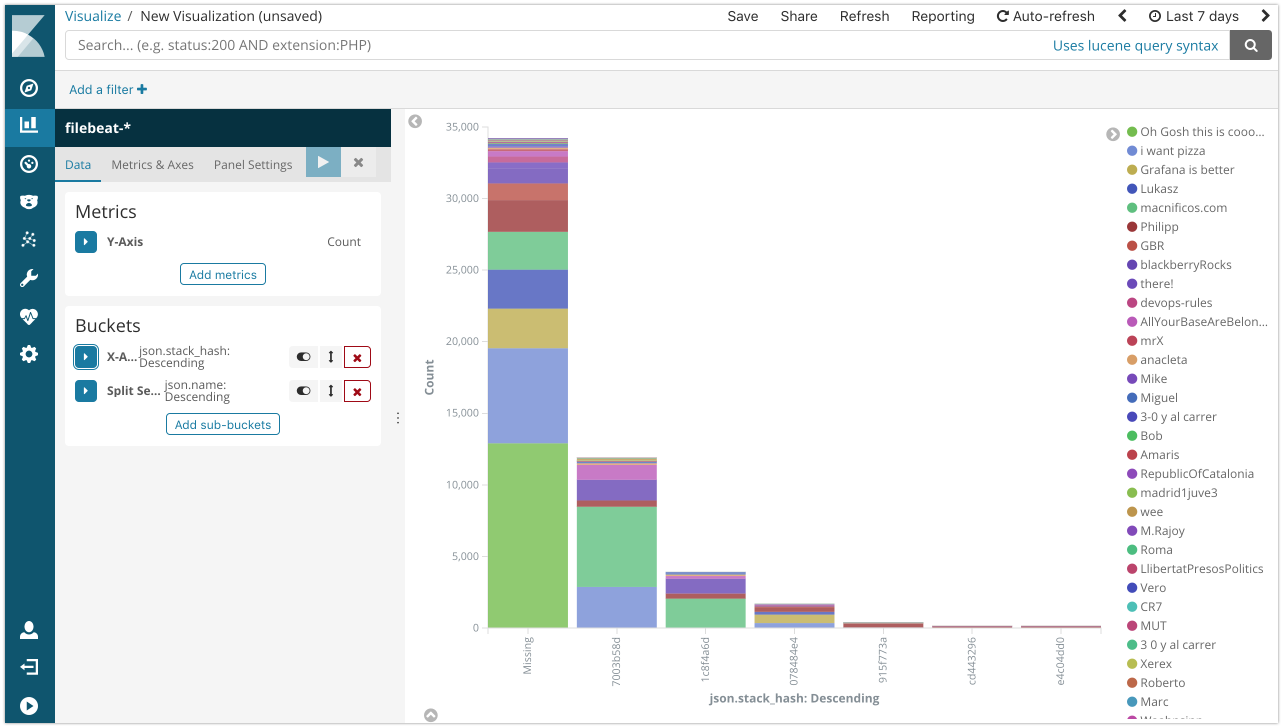
- Filebeat: Let attendees hit /good with a parameter and point out the MDC logging under
json.nameand the context view for one log message. Let attendees hit /bad and /null to show the stacktrace both in the JSON log file and in Kibana by filtering down onapplication:javaandjson.severity: ERROR. Also point out the cloudmeta.*andhost.*information. And show thejson.stack_hash, which you can use for visualizations too.
- Auditbeat: Show changes to the /opt/ folder with the [Auditbeat File Integrity] Overview dashboard.
- Heartbeat: Run Heartbeat and show the Heartbeat HTTP monitoring dashboard in Kibana, then stop and start the frontend application with
ansible-playbook restart_frontend.ymlor do it manually and see the change. - Metricbeat nginx: Show the [Metricbeat Nginx] Overview dashboard.
- Metricbeat HTTP: Show /health and /metrics with cURL (credentials are
adminandsecret). Then collect the same information with Metricbeat's HTTP module and show it in Kibana's Discover tab. - Metricbeat JMX: Display the same /health and /metrics data and its collection through JMX.
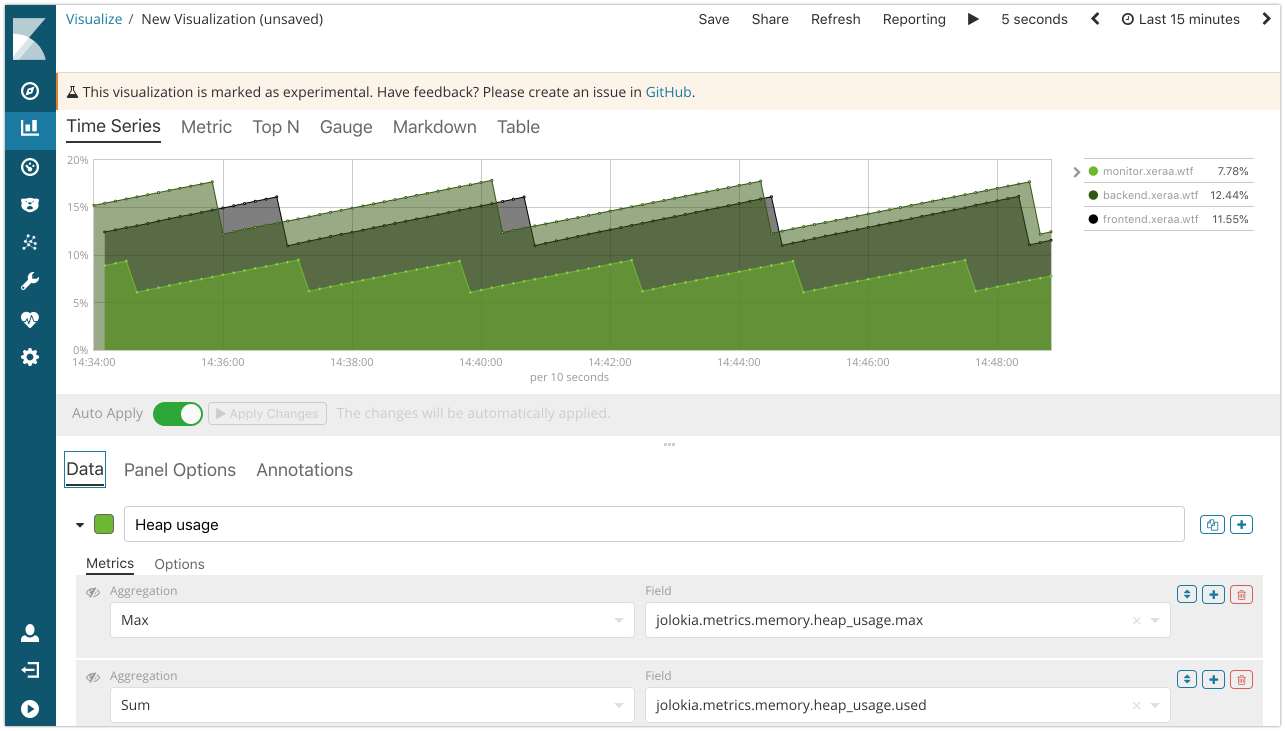
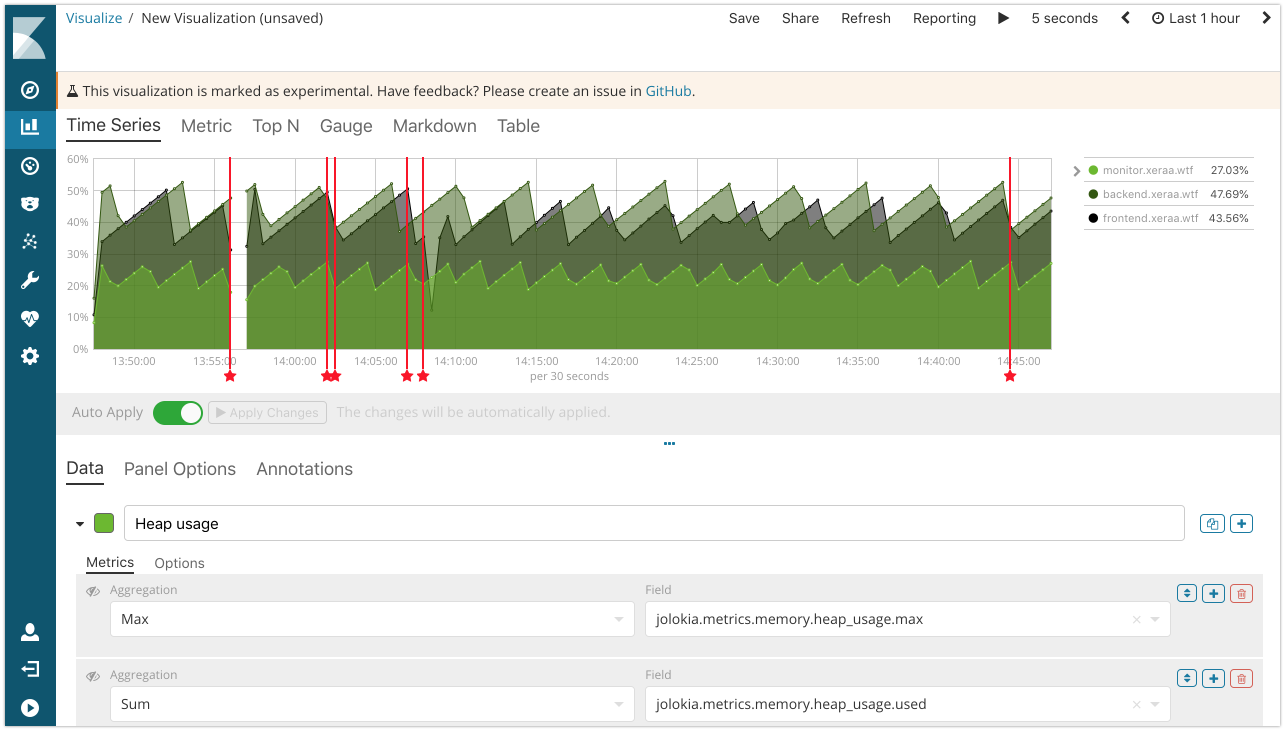
- Visual Builder: Build a more advanced visualization with the Time Series Visual Builder, for example to show the heap usage in percent by calculating the average of
jolokia.metrics.memory.heap_usage.useddivided by the max ofjolokia.metrics.memory.heap_usage.max.
- Annotations: Include the deployment events as an annotations.
- APM: Show the traces so far. Then let the attendees hit /call and /call-bad to see where the slowness is coming from and how errors look like. If there is not enough activity on the instances, call
./ab.shon the monitor instance. - Kibana Dashboard Mode: Point attendees to the Kibana instance to let them play around on their own.
If the network connection is decent, show it on Amazon Lightsail. Otherwise fall back to the local setup and have all the dependencies downloaded in advance.
Make sure you have run this before the demo, because some steps take time and require a decent internet connection.
- Make sure you have your AWS account set up, access key created, and added as environment variables in
AWS_ACCESS_KEY_IDandAWS_SECRET_ACCESS_KEY. Protip: Use https://github.com/sorah/envchain to keep your environment variables safe. - Create the Elastic Cloud instance with the same version as specified in variables.yml's
elastic_version, enable Kibana as well as the GeoIP & user agent plugins, and set the environment variables with the values forELASTICSEARCH_HOST,ELASTICSEARCH_USER,ELASTICSEARCH_PASSWORD, as well asKIBANA_HOST,KIBANA_ID. - Change into the lightsail/ directory.
- Change the settings to a domain you have registered under Route53 in inventory, variables.tf, and variables.yml. Set the Hosted Zone for that domain and export the Zone ID under the environment variable
TF_VAR_zone_id. If you haven't created the Hosted Zone yet, you should set it up in the AWS Console first and then set the environment variable. - If you haven't installed the AWS plugin for Terraform, get it with
terraform initfirst. Then create the keypair, DNS settings, and instances withterraform apply. - Open HTTPS on the network configuration on all instances and TCP 8200 on the monitoring instance (waiting for this Terraform issue).
- Apply the base configuration to all instances with
ansible-playbook configure_all.yml. - Apply the instance specific configuration with
ansible-playbook configure_monitor.yml— frontend and backend don't have specific configurations. - Deploy the JARs with
ansible-playbook deploy_bad.yml,ansible-playbook deploy_backend.yml,ansible-playbook deploy_frontend.yml, andansible-playbook deploy_zipkin.yml(Ansible is also building them).
When you are done, remove the instances, DNS settings, and key with terraform destroy.
Very similar to the Lightsail setup above. The main difference is that everything is running on one instance and you need to open the port 5601 for Kibana (Elasticsearch, APM,... are only accessible on localhost).
Credentials:
- SSH:
ssh workshop@workshop-<number>.xeraa.wtfworkshop / secret - Elasticsearch:
http://localhost:9200admin / secret - Kibana:
http://workshop-<number>.xeraa.wtf:5601admin / secret
Make sure you have run this before the demo, because some steps take time and require a decent internet connection.
- Change into the local/ directory.
- Run
docker-compose up, which will bring up Elasticsearch, Kibana, and all the Beats. - Run the Java applications from their directories with
gradle bootRun.
When you are done, stop the Java applications and remove the Docker setup with docker-compose down -v.
- Configurable APM token and enable TLS
- https://codecentric.github.io/chaos-monkey-spring-boot/
- Micrometer / http://docs.spring.io/spring-boot/docs/current/reference/html/production-ready-metrics.html
- MySQL on the backend with TCP Heartbeat monitoring
- Docker
- Improve traced methods and add async
- https://www.elastic.co/guide/en/logstash/current/plugins-outputs-cloudwatch.html (https://aws.amazon.com/about-aws/whats-new/2017/09/amazon-route-53-announces-support-for-dns-query-logging/ etc)


