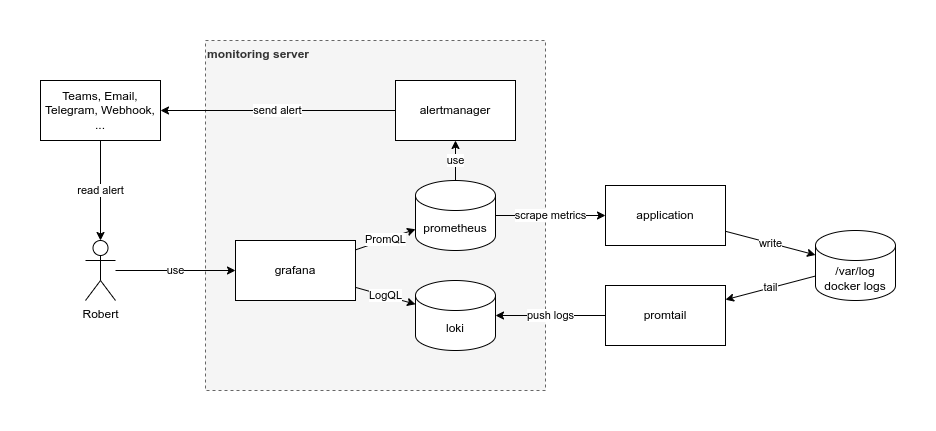
By default this runs at the domain moni.0-main.de 1 exposing ...
- Grafana Dashboard
- Prometheus UI
- node exporter metrics
- cadvisor metrics
- blackbox HTTP ping metrics
- loki
Please note that all of these are also exposed via plain HTTP without TLS to make scraping easier, because you get to see the same endpoints as prometheus does. However you should disable this in security-sensitive contexts.
We bind Loki to 127.0.0.1:3100. Please refer to
https://github.com/felixhummel/deploy-promtail on usage. Note that in a
production setup your Loki instance would run on another machine.
To use it as is, make sure that you have our ingress installed and running at version 2022-05.2 or greater.
cat <<'EOF' > .env
GF_SECURITY_ADMIN_PASSWORD=changeme
EOF

docker-compose up -d --build --remove-orphans
dig moni.0-main.de +short
Run otel example:
cd example/otel/
mise trust
mise install
uv run main.py
Visit the Grafana Dashboard.
Replace moni.0-main.de with your TLD, e.g.:
rg -l 'moni\.0-main.de' | rg -v README.md \
  | xargs -L1 sed -i -e 's/moni\.0-main.de/example.com/'
We deliberately kept the many duplicates of fully qualified domain names to keep readability high and aid debugging (think copy&paste).
vi prometheus/prometheus.yml
docker-compose kill -s SIGHUP prometheus

vi grafana/provisioning/
docker-compose restart grafana
Footnotes
-
Our domain
0-main.depoints to localhost (see https://blog.hukudo.de/infra/0-main.html for more information) ↩
