This document contains the workflow for the processing of the Facebook Population Density Data and the NOAH hazard maps to compute for the total area of population and the area of affected population per hazard level. Open-source tools like Python, GeoPandas, Fiona, GDaL, and QGIS will be used for this methodology.
- Python 3.9.1 or higher
- Python
os - Python
geopandas 0.9.0 - Python
fiona 1.8.19 - Python
pandas 1.2.1 - Python
numpy 1.19.5 - GDAL
- QGIS 3 or higher
All of the mentioned tools above are mandatory, so make sure that you have properly set-up everything before you run the scripts.
- Install
Python 3.9.1or higher on your machine. You may check this link for the active Python releases. Alternatively, you may installAnacondaPython distribution. This already contains packages for GDAL (that is also required for this set-up). Check this link to download and install Anaconda. - Download
pipon your machine. For Windows users, check this guide. - Download
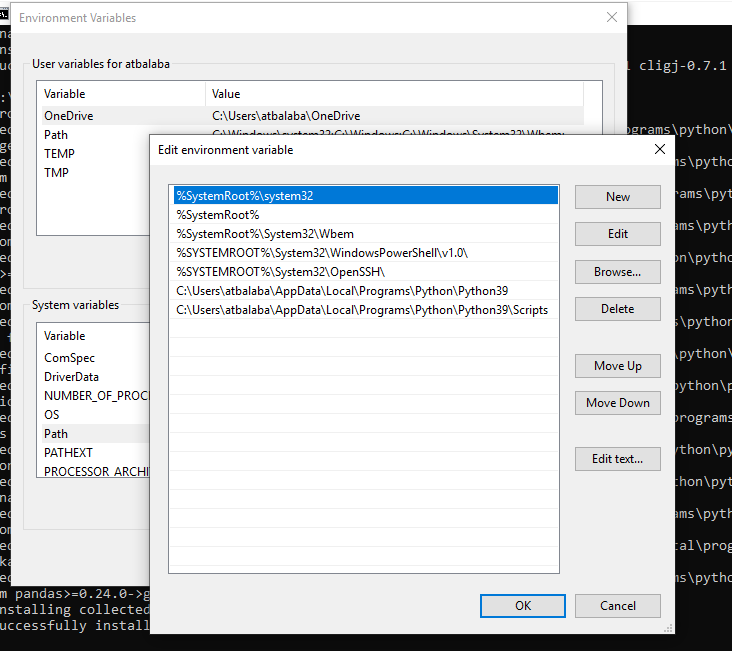
GDALand other dependencies mentioned on your machine. GDAL is a translator library for raster and vector spatial data formats. We will be using GDAL to process the raster data from Facebook. Check this link to download. - Once everything is downloaded on your machine, we need to tell your OS where the python and pip installations are located. We need to add some system variables on your python path.
- Install the dependencies by doing:
pip install file.whl. - For Anaconda users, you may install GDAL by running
conda create -n gdal_env -c conda-forge gdalon your conda terminal.
The processing of the data is divided into three methods:
- Pre-processing of the data (Part 1). This involves clipping the population density (raster) to your assigned province and converting the clipped population density to a vector format using a python script.
- Pre-processing of the data (Part 2). This method involves using QGIS model builder to be able to run fix geometries of the converted population density data and intersect this with the barangay boundaries containing the 2015 census data.
- Processing of the population and hazard data. This part involves computation of the area of population per barangay and the area of affected population per hazard level. This will be used to compute the total affected population per hazard. This part will be ran using a python script.
- Generation of pivot table. This contains a pivot table of the computation generated from the processing script.
To be able to conduct this process, you need to prepare the following data:
(Boundary_Province_Visual.shp). No need to rename/reproject the file.
(FBPD_utm.tif) This is already reprojected to UTM so no need to reproject. Please do not rename the file as well.
(bgys_utm.shp)
- Hazard (SSA4, Landslide Hazards, and 100-Year Flood) per province. Name it as:
Province_StormSurge_SSA4.shp,Province_Fl.shp,Province_LH.shp
The python scripts are modeled to read input files and produce output files in a structured format. Hence, you need to follow the steps below.
-
Download the python scripts and the model builder from this repository.
-
On your machine, identify where you will place the python scripts and the input files (data required). All of these data must be stored on your base folder path.
e.g.
/Users/localUser/UPRI/FacebookProcessing -
Insider this base folder path, create the following folders:
inputProvince 1Province 2Province 3
When naming the Province folders, make sure to name it according to the Pro_Code column of the IMTWG Provincial Boundaries data. Failure to name it in this format will cause the Pre-Processing script to fail.
All output files will be stored separately on the designated Province folder inside the output folder. These folders are automatically generated from the script.
Your folder configuration should look similar to this:
/Users/localUser/UPRI/FacebookProcessing
- config.py
- pre-processing.py
- processing.py
- pivot_table.py
inputProvince 1- SSA4
- LH
- Fl
Province 2- SSA4
- LH
- Fl
Province 3- SSA4
- LH
- Fl
output(only generated when you ran the script)Province 1Province 2Province 3
- On your terminal (cmd prompt/ conda), go to your base folder path. Run
cd /Users/localUser/UPRI/FacebookProcessing - Run
python pre-processing.pyto generate the clipped population density data and the polygonized population density data. - If successfully ran, your terminal should look similar like this:
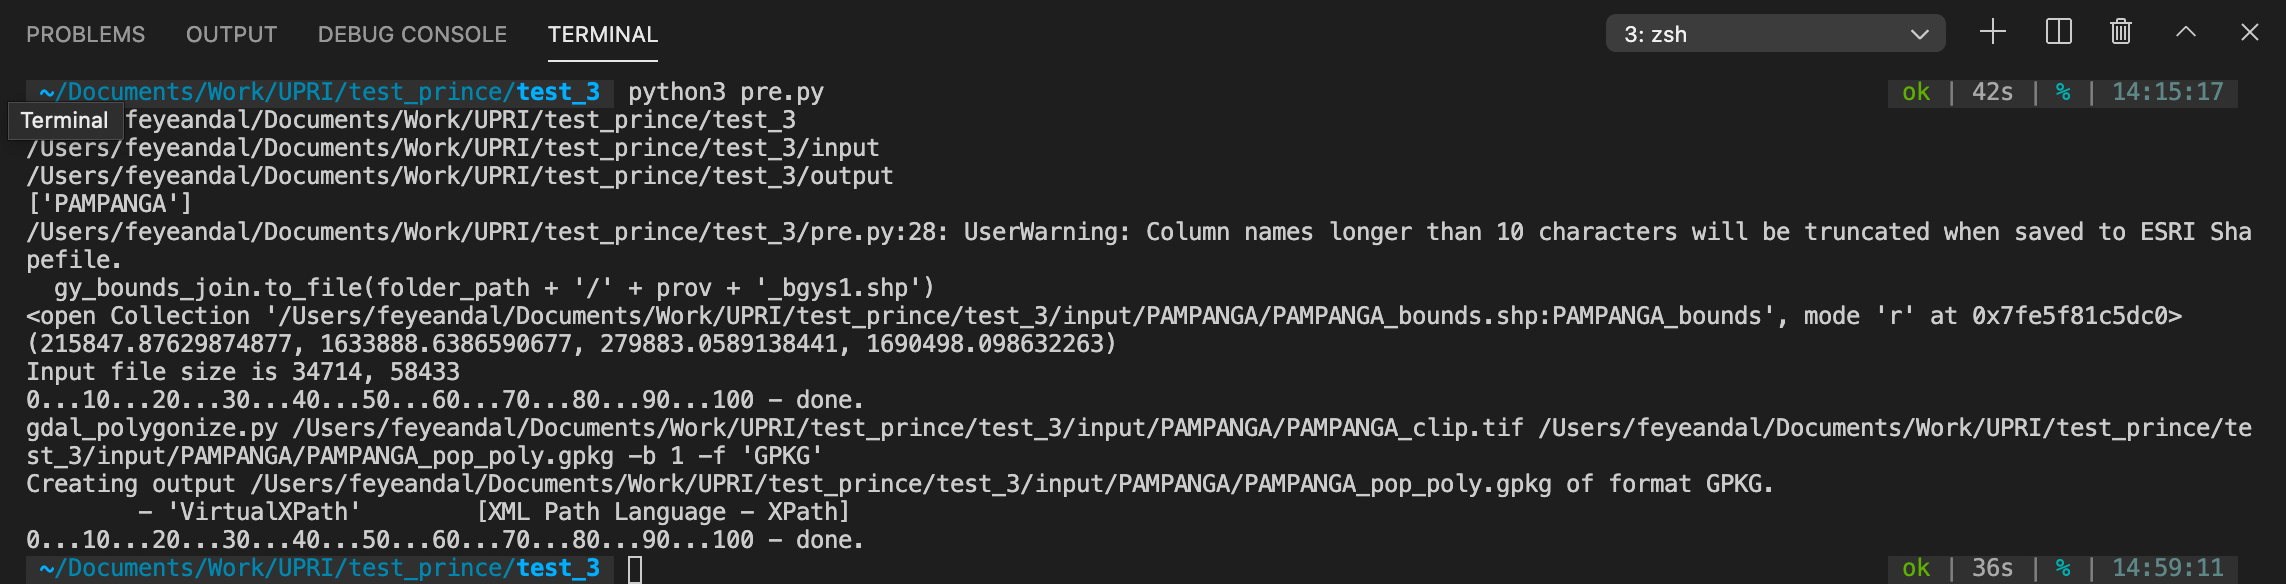
- Check your
input>Provincefolders for the generated files:Province_clip.tif- clipped population data according to provinceProvince_pop_poly.gpkg- polygonized population dataProvince_bounds.shp- provincial boundaryProvince_bgys.shp- barangay boundary for this province
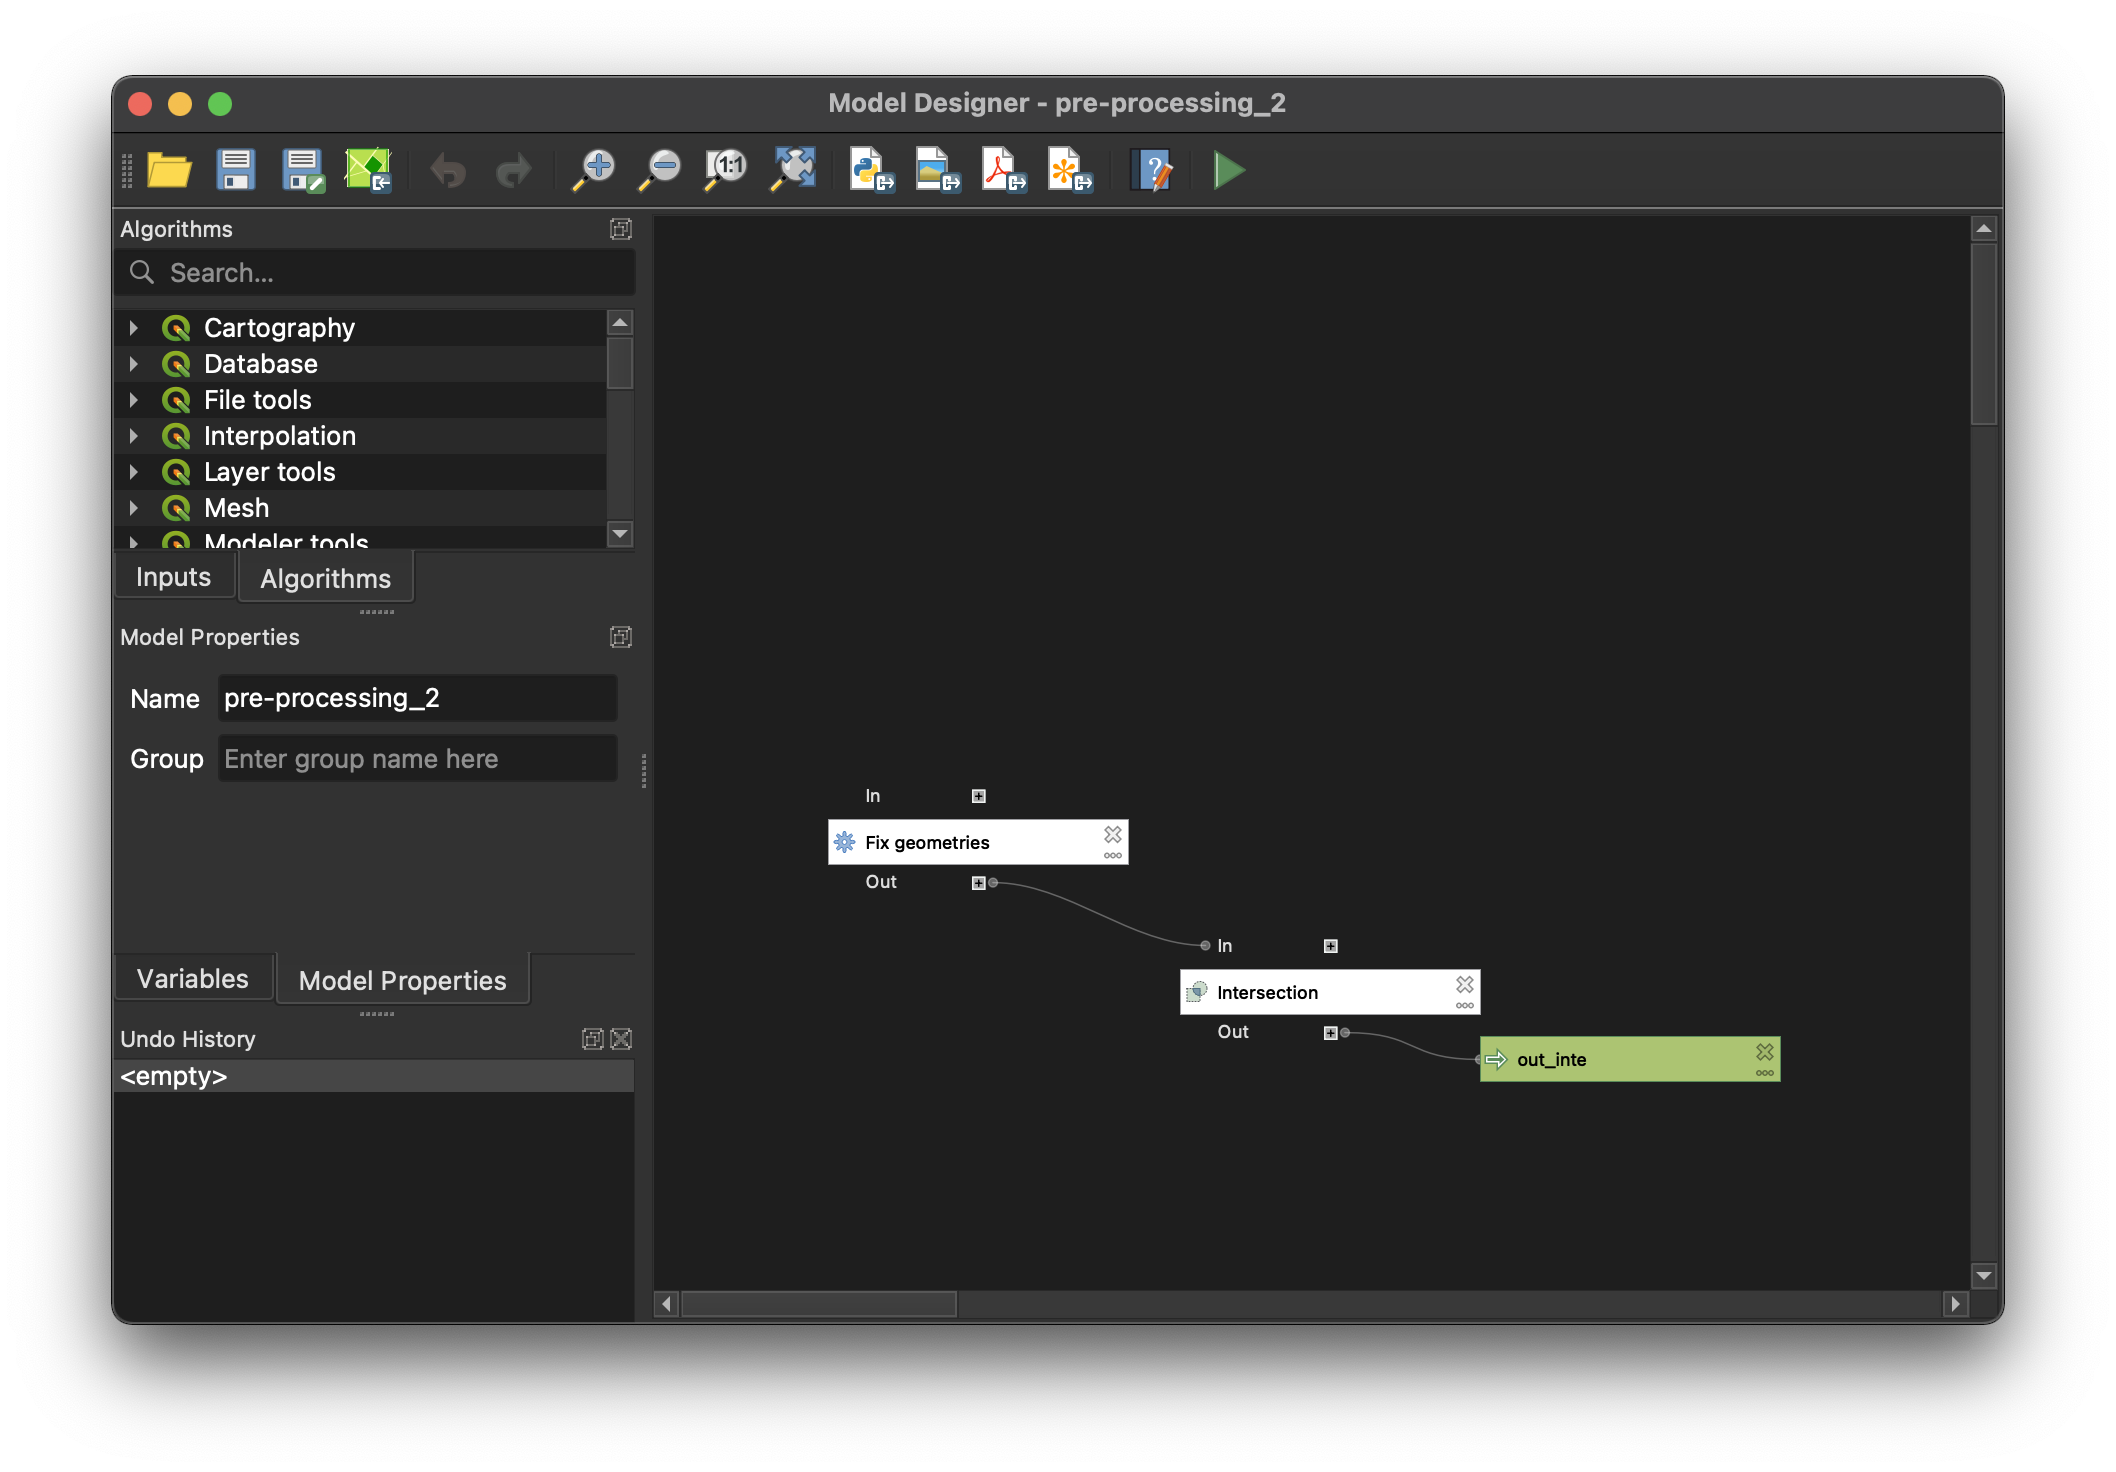
In this step, you will be needing to run the pre-processing tool using QGIS. This model is designed to process only one province at once so this might take some time.
- Open QGIS.
- Go to
Processing>Graphical Modeler>Open>pre-processing_2.model3>Open - Double-click the
Fix Geometriesalgorithm and select theInput Layeras the_poly.gpkgfrom yourInput>Provincefolder. This is one of the output files from the Pre-processing Part 1. - In the
Intersectionalgorithm, set theInput Layeras the barangay boundaries (_bgys.shp) from yourInput>Provincefolder. - Click
Run modelto start the processing.
-
You will be asked for the output path and file for
out_inte. Name it asProvince 1_inte.gpkgthen clickRun. -
Wait for it to finish running and processing.
Once you have completed the first two pre-processing steps, you are now ready to proceed with the processing method.
- On your terminal, run
python processing.py - The intersection may take a while especially if you have large input files size. Wait for it to finish running and check the output files from the
output>Provincefolders. - Your
output>Provincefolder should contain the following:Province_Haz_utm.shp- reprojected hazard to UTMProvince_Haz_diss.shp- dissolved version of the reprojected hazardProvince_Haz_Bgy.shp- intersected vector of the dissolved hazard vector and the polygonized population data. This contains the computation of area of population, area of hazard, and number of affected population that is aggregated per barangay
- Run
python pivot_table.pyon your terminal. - Check your
output>Provincefolder and open the generated pivot table (_affected.csv).