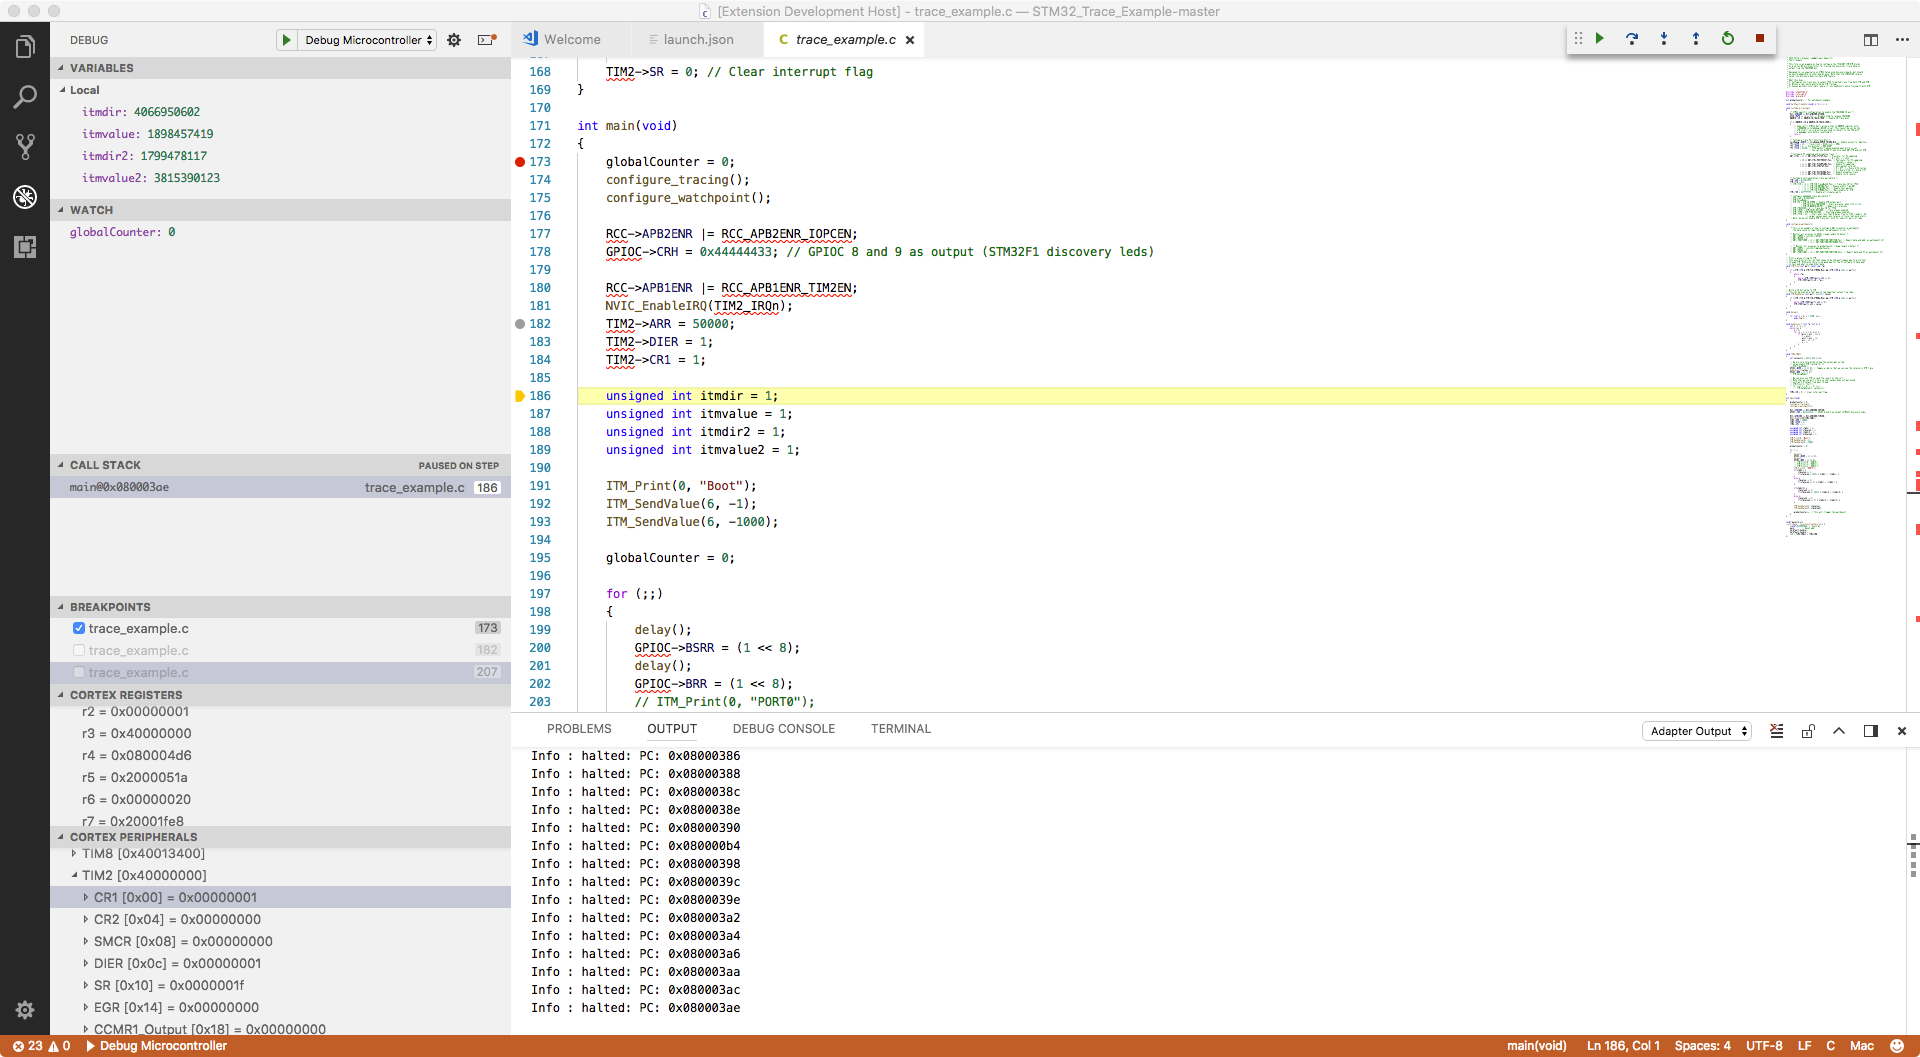
Debugging support for ARM Cortex-M Microcontrollers with the following features:
- Support J-Link, OpenOCD GDB Server, pyOCD
- Initial support for STMicroelectronic's ST-LINK GDB server (no SWO support yet)
- Partial support textane/stlink (st-util) GDB Servers (SWO can only be captured via a serial port)
- Initial support for the Black Magic Probe (This has not been as heavily tested; SWO can only be captured via a serial port)
- Experimental, coming in V1.2+: Multi-core and multi-session debugging. See https://github.com/Marus/cortex-debug/wiki/Multi-core-debugging
- Experimental, coming in V1.2+: Disassembly of source code available along with instruction level breakpoints and stepping. See https://github.com/Marus/cortex-debug/wiki/Disassembly-Debugging
- Cortex Core Register Viewer (Integrated into Variables Window in V1.2+)
- In some cases the st-util GDB server can report incomplete/incorrect registers, so there may be some issues here.
- Peripheral Register Viewer (Defined through standard SVD file)
- SWO Decoding - "console" text output and binary data (signed and unsigned 32-bit integers, Q16.16 fixed point integers, single percision floating point values)
- The registers that are part of the DWT, TPIU, and ITM debug components will automatically be configured and do not need to be set in firmware.
- Firmware may still need to enable the SWO output pin - as this part of the setup is microcontroller dependant.
- Decoding ETM data over the SWO pin is not currently supported.
- Support for Custom ITM Data Decoders:
- Ability to define JavaScript modules to decode complex data formats streamed over one or more ITM ports. Data can be printed to a output window, or sent to the graphing system.
- Live graphing of decoded ITM data.
- Support for SEGGER Real Time Trace (RTT) using OpenOCD and JLink gdb-servers. All the features supported for SWO (text, binary, graphing) are also supported with RTT.
- Raw Memory Viewer ("Cortex-Debug: View Memory" command)
- Ability to view and step through the disassembled binary. There are three ways that disassembled code will be shown:
- Disassembly code will automatically be shown if it cannot locate the corresponding source code.
- You can manually see the disassembly for a particular function ("Cortex-Debug: View Disassembly (Function)" command)
- You can set the debugger to always show show disassembly ("Cortex-Debug: Set Force Disassembly" command)
- Globals and Static scopes in the variables view
- Initial support for Rust code (most functionality is working; disassembly views and variables view may still have issues)
- RTOS Support (J-Link, OpenOCD, pyOCD) - RTOS supported depends on GDB server support)
- As a general rule do not try to use stepping instructions before the scheduler of your RTOS has started - in many cases this tends to crash the GDB servers or leave it in an inconsistent state.
- Additional Graphing Options
- Enhanced SVD Auto-selection
- Semihosting Support (this should be working now)
Requirements:
- ARM GCC Toolchain (https://developer.arm.com/open-source/gnu-toolchain/gnu-rm/downloads) - provides arm-none-eabi-gdb and related tools
- At least one of:
- J-Link Software Tools - provides the J-Link GDB Server for J-Link based debuggers (https://www.segger.com/downloads/jlink)
- OpenOCD - provides a GDB Server that can be used with a number of debuggers (http://openocd.org)
- NOTE: On macOS do not use the default version of OpenOCD provided by homebrew, this is not compatible with releases V0.2.4 and newer. You can either install from source using homebrew (
brew install open-ocd --HEAD) or the packages from https://github.com/gnu-mcu-eclipse/openocd/releases will also work. Some linux versions and Windows may also need a more up-to-date version of OpenOCD from the gnu-mcu-eclipse releases.
- NOTE: On macOS do not use the default version of OpenOCD provided by homebrew, this is not compatible with releases V0.2.4 and newer. You can either install from source using homebrew (
- Texane's st-util GDB server - Only supports ST-Link Debug Probes (https://github.com/texane/stlink)
- ST-LINK GDB server - This server is packaged with the STM32CubeIDE which must be installed. The location of the STM32CubeIDE and related tools is automatically resolved but also can be overridden using configuration settings (
armToolchainPath,stm32cubeprogrammerandserverpath). - pyOCD GDB Server - GDB server that supports the CMSIS-DAP debugger on a number of mbed boards (https://github.com/mbedmicro/pyOCD)
- Black Magic Probe
See https://github.com/Marus/cortex-debug/wiki for usage information. This needs some help from the community. See https://github.com/Marus/cortex-debug/blob/master/debug_attributes.md for a summary of all properties that are available in your launch.json
git clone https://github.com/Marus/cortex-debug.gitcd cortex-debug- Optionally switch to a branch:
git checkout <existing-branch-name> npm install- Optional
npm run compile - Open VSCode in this folder and run the task
npm watch. This will compile the code and watch for any changes and auto compile. The first time, it may take a minute or so for it to watch the entire folder. You can see the output ofnpm watchin the Terminal tab.
The extension is split into two main parts.
- The front-end which is what you interact with mostly
- The backend called
debug adapterwhich interfaces betweengdb,vscode/front-end, and thegdb-server. We just start the server and from then on the debug adapter only interacts withgdb. All requests go togdband the results are read back fromgdbusinggdb's MI (machine interface)
If you want to debug both parts, in launch.json use the Extension + Debug Server configuration. It will launch a new window -- the debuggee. In the debuggee VSCode window, load a FW folder/workspace (VSCode remembers the last one) and add the following to debuggee's launch.json.
"debugServer": 4711
Now, launch a debug session and you wil be able to use the primary VSCode window to observe the Cortex-Debug extension
Parts of this extension are based upon Jan Jurzitza's (WebFreak) code-debug extension (https://github.com/WebFreak001/code-debug). His project provided an excellent base for GDB MI parsing and interaction.
