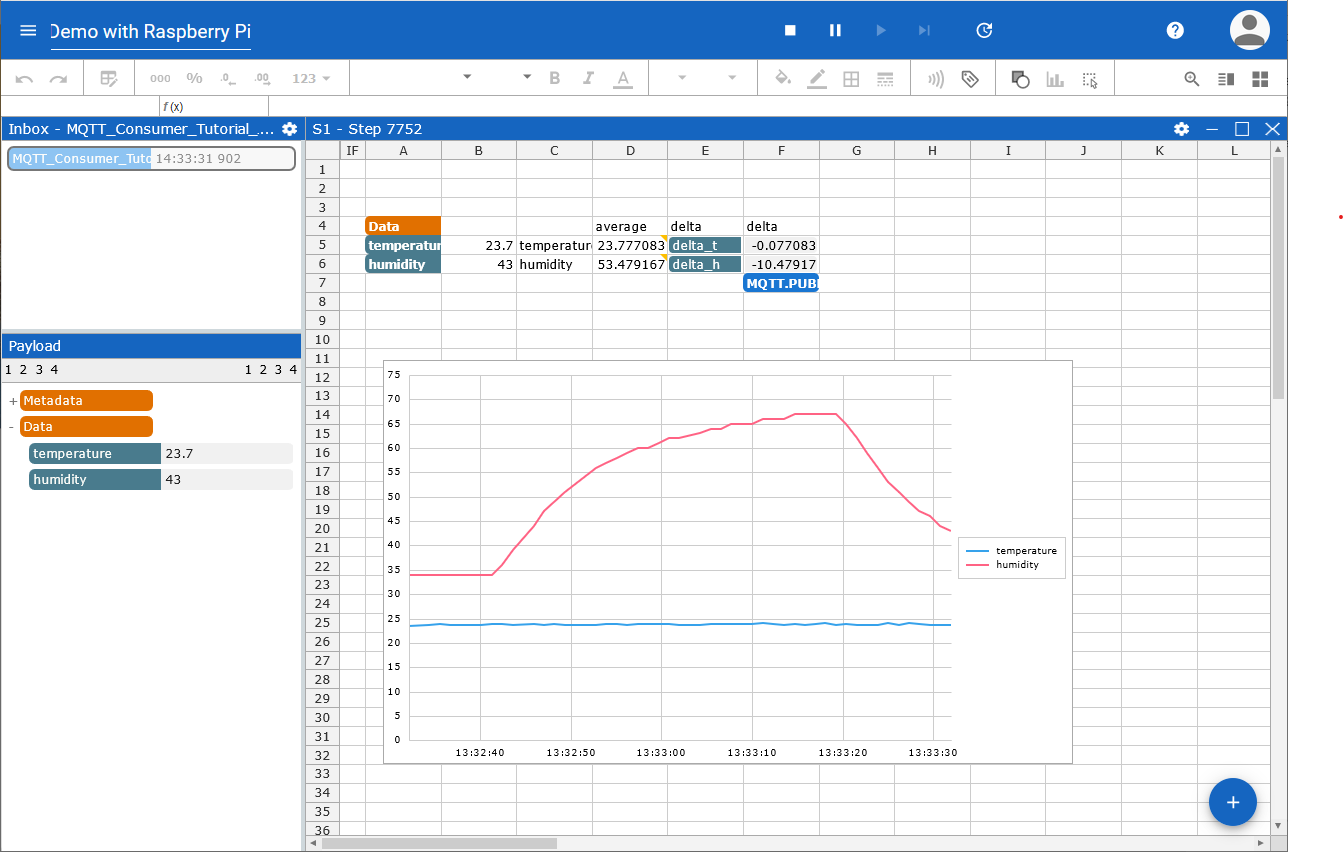
This demo project consists of the following components:
- A MQTT producer sending temperature and humidity
- A Streamsheets app calculating the trend
- A MQTT consumer drawing the trends on the 8×8 pixel display as bars
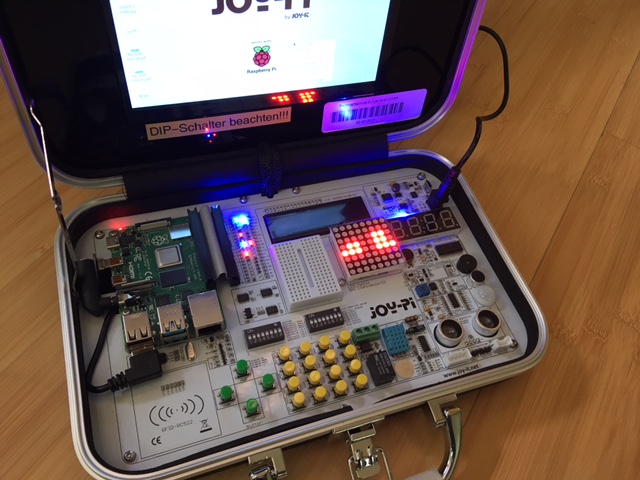
Used hardware: Joy-Pi experimental case
The sensor is the blue part in the lower part.
- Install Streamsheets. It runs the MQTT broker. I've installed it on a virtual machine running Debian.
- Install the necessary libraries to run the DHT11 sensor and the LED matrix as written in the manual (German version).
- Install Paho MQTT on the Raspberry Pi.
- Start Streamsheets by executing
./start.sh. - Open Streamsheets in the browser on http://ip address:8081
- Login using your credentials.
- Import the Streamsheets app .
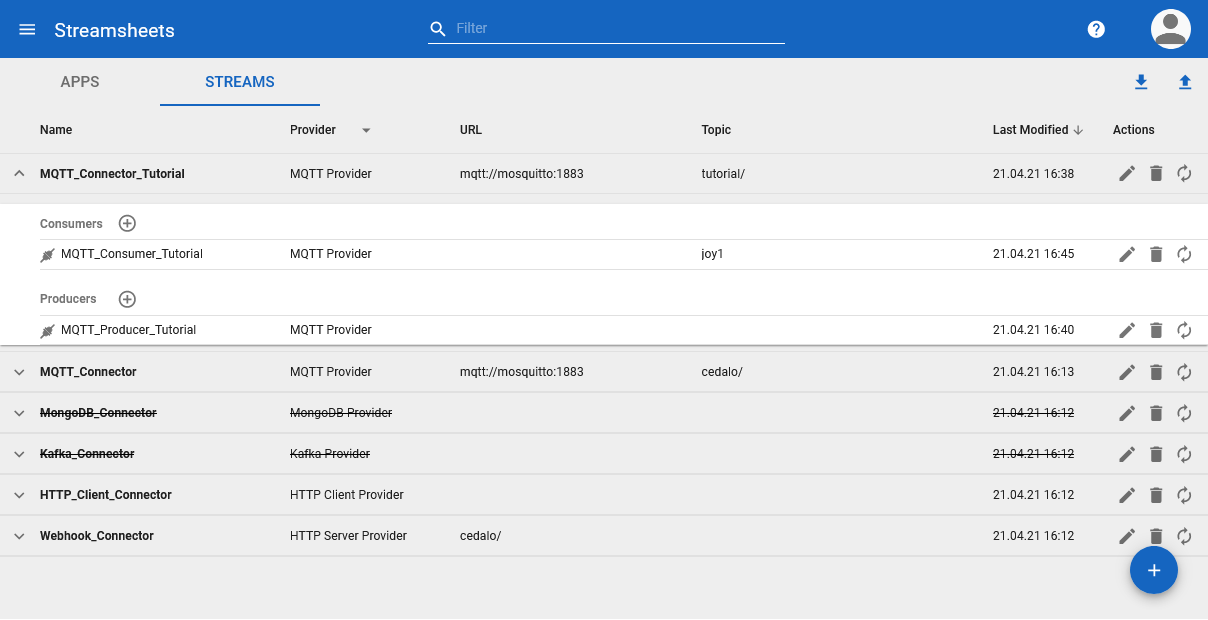
- Create the necessary MQTT connector and streams. It uses the local MQTT broker, which is already created by the installation. The topic of the connector is tutorial/. The topic of the consumer stream is joy1.

- Run the app by pressing the start button on the sheet.
- Set the following environment variables MQTT_SERVER, MQTT_USERNAME (most probably streamsheets) and MQTT_PASSWORD (see the password on the connector settings).
- Run
./send_mqtt.pyin one terminal. - Run
./receive_mqtt.pyin the other terminal. - Enjoy it!
This is the project described above. It was created for a demo at the University of Applied Sciences Burgenland.
- Used scripts on Raspberry Pi: send_mqtt.py, receive_mqtt.py
- Used Streamsheets file: Demo_with_Raspberry.streamsheets.json
- Demo video (in German language): https://www.youtube.com/watch?v=MzzdVWa0WoU
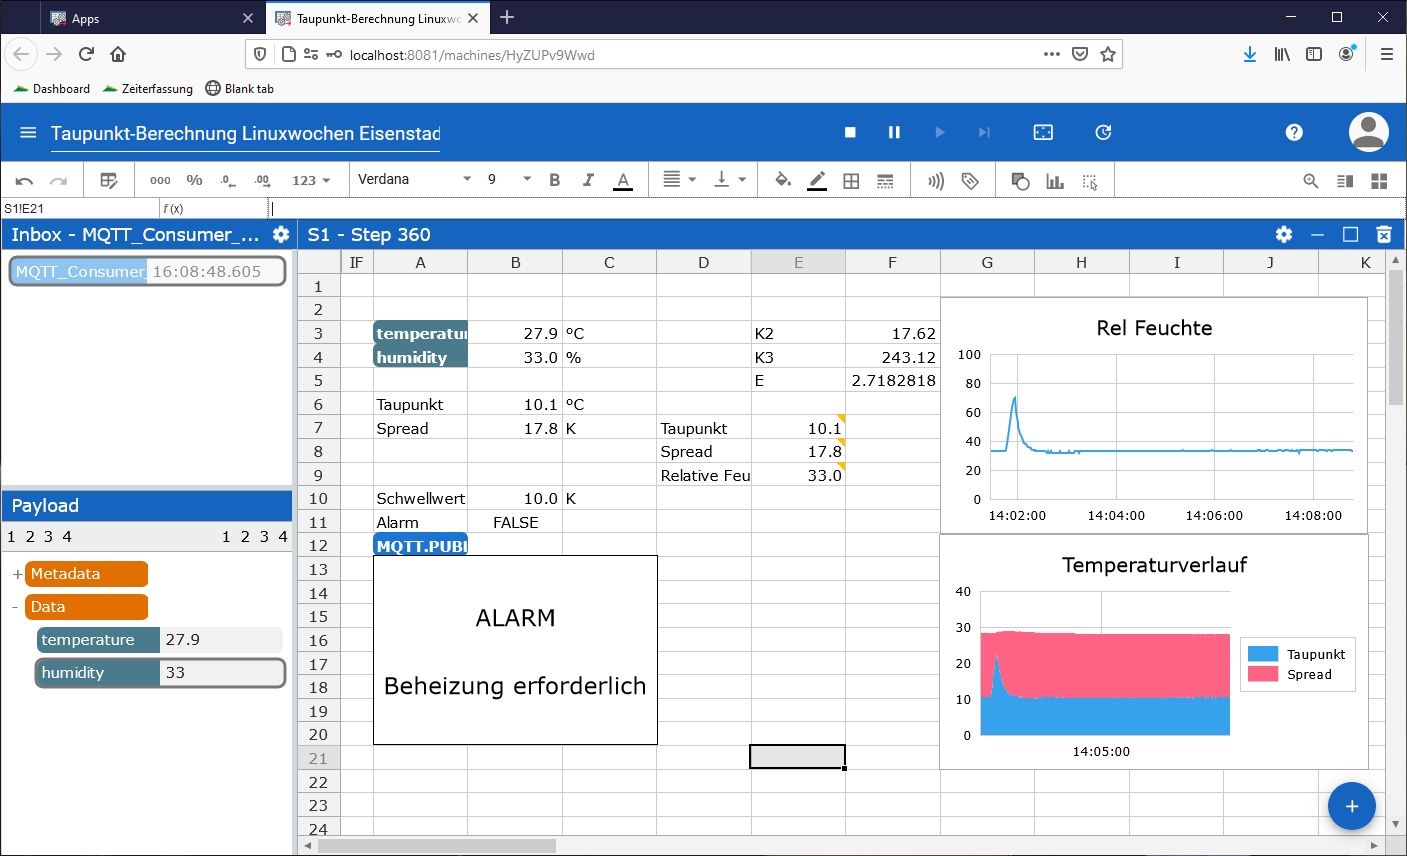
A project calculating the dew point using temperature and humidity, extended with an alarm, if the spread is too low.
This project was build for a presentation at the local Linux event called Linuxwochen Eisenstadt.
- Used scripts on Raspberry Pi: send_mqtt.py, alarm.py
- Used Streamsheets file: Dew_point_calculation.streamsheets.json
- Presentation (in German language)
- Video (sorry for the wrong colors)


