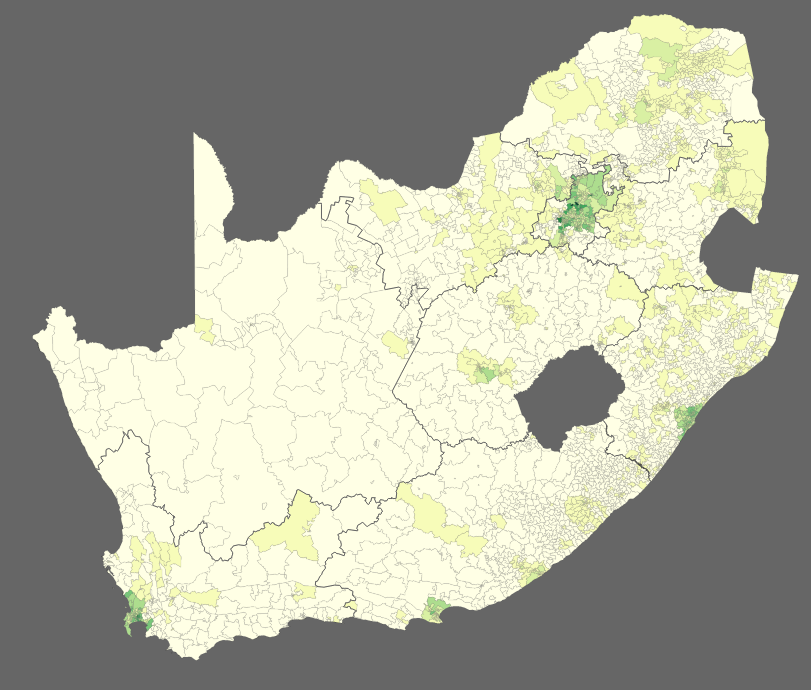
How to create a ward level map of the South African population using D3.
##Part 1: Getting and preparing the data ##
Shape files from the demarcations board
http://www.demarcation.org.za/
Convert to GeoJSON here
http://converter.mygeodata.eu/vector
Combine with topojson
https://github.com/mbostock/topojson/wiki/Command-Line-Reference
$ topojson -o za.json --properties wards.json prov.json
Shrink with MapShaper
http://en.wikipedia.org/wiki/Coastline_paradox
##Part 2: Making it look neat ##
Choosing a projection
https://github.com/mbostock/d3/wiki/Geo-Projections
SVG styling
http://www.w3schools.com/svg/default.asp
##Part 3: Adding colour##
Population Data
http://interactive.statssa.gov.za/superweb/login.do
Use color brewer
population.cvs
https://github.com/fletchjeff/datavizmeetup/blob/master/data/population.csv
##Part 4: Bells and whistles## Pan and Zoom and Tool tip for mouse overs
Useful starting points in D3
http://bost.ocks.org/mike/join/
http://bost.ocks.org/mike/selection/