![]()
The Seaweed Growth Model is a tool that simulates the potential growth of seaweed in the aftermath of a nuclear war. The output of the model can be used to identify areas where seaweed growth is be possible. This model can be useful for researchers, environmentalists, and disaster response teams who are interested in understanding the potential impact of nuclear war on marine life. The model is implemented in Python and can be easily integrated into other analysis and visualization tools.
To install the Seaweed Growth Model package, we recommend setting up a virtual environment. This will ensure that the package and its dependencies are isolated from other projects on your machine, which can prevent conflicts and make it easier to manage your dependencies. Here are the steps to follow:
-
Create a virtual environment using either conda by running the command
conda env create -f environment.yml. This will create an environment called "seaweed-growth-model". A virtual environment is like a separate Python environment, which you can think of as a separate "room" for your project to live in, it's own space which is isolated from the rest of the system, and it will have it's own set of packages and dependencies, that way you can work on different projects with different versions of packages without interfering with each other. -
Activate the environment by running
conda activate seaweed-growth-model. This command will make the virtual environment you just created the active one, so that when you run any python command or install any package, it will do it within the environment. -
Install the package by running
pip install -e .in the main folder of the repository. This command will install the package you are currently in as a editable package, so that when you make changes to the package, you don't have to reinstall it again. -
If you want to run the example Jupyter notebook, you'll need to create a kernel for the environment. First, install the necessary tools by running
conda install -c anaconda ipykernel. This command will install the necessary tools to create a kernel for the Jupyter notebook. A kernel is a component of Jupyter notebook that allows you to run your code. It communicates with the notebook web application and the notebook document format to execute code and display the results. -
Then, create the kernel by running
python -m ipykernel install --user --name=seaweed-growth-model. This command will create a kernel with the name you specified "seaweed-growth-model" , which you can use to run the example notebook or play around with the model yourself.
You can now use the kernel "seaweed-growth-model" to run the example notebook or play around with the model yourself. If you are using the kernel and it fails due an import error for the model package, you might have to rerun: pip install -e ..
If you encounter any issues, feel free to open an issue in the repository.
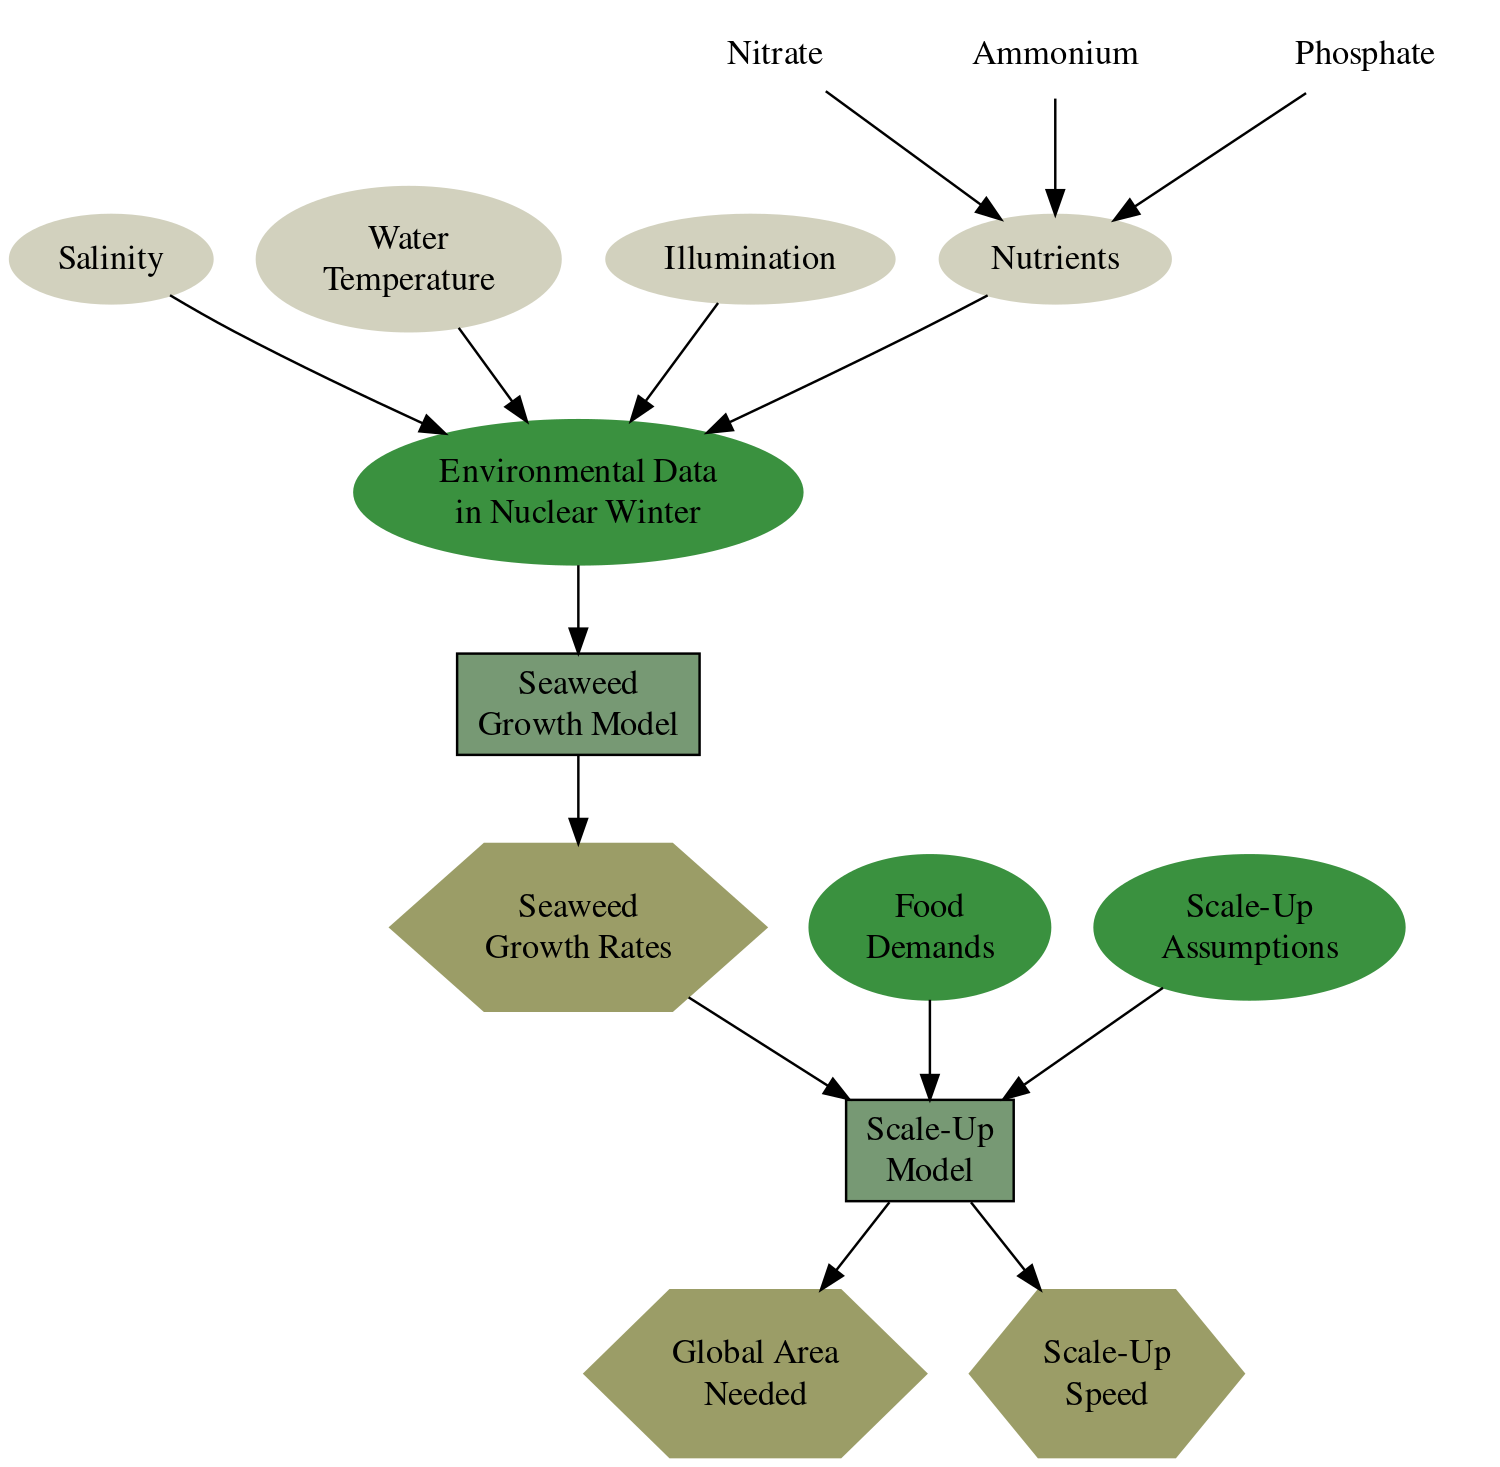
This model here uses nuclear winter environmental data and an empirical model based on James and Boriah (2010). It calculates the growth rate of Gracilaria tikvahiae on a global scale. The growth rate results are then used to simulate the scale-up of seaweed production.
An example notebook on how this model can be used can be found in the script folder. This example runs out of the box with the test data delivered with this repository. If you want to reproduce the results, you have to download the complete dataset.
The data is available in a Zenodo Repository. Once you download it simply copy it to data/gridded_data_global folder. Once there, you can run the model with the global data. However, if you just want to play around with the model, there is a dataset available for testing directly in this repository.
The data is stored in the pickle format to ensure a quick read time, as the overall dataset is several gigabytes large. Learn more about pickle here.
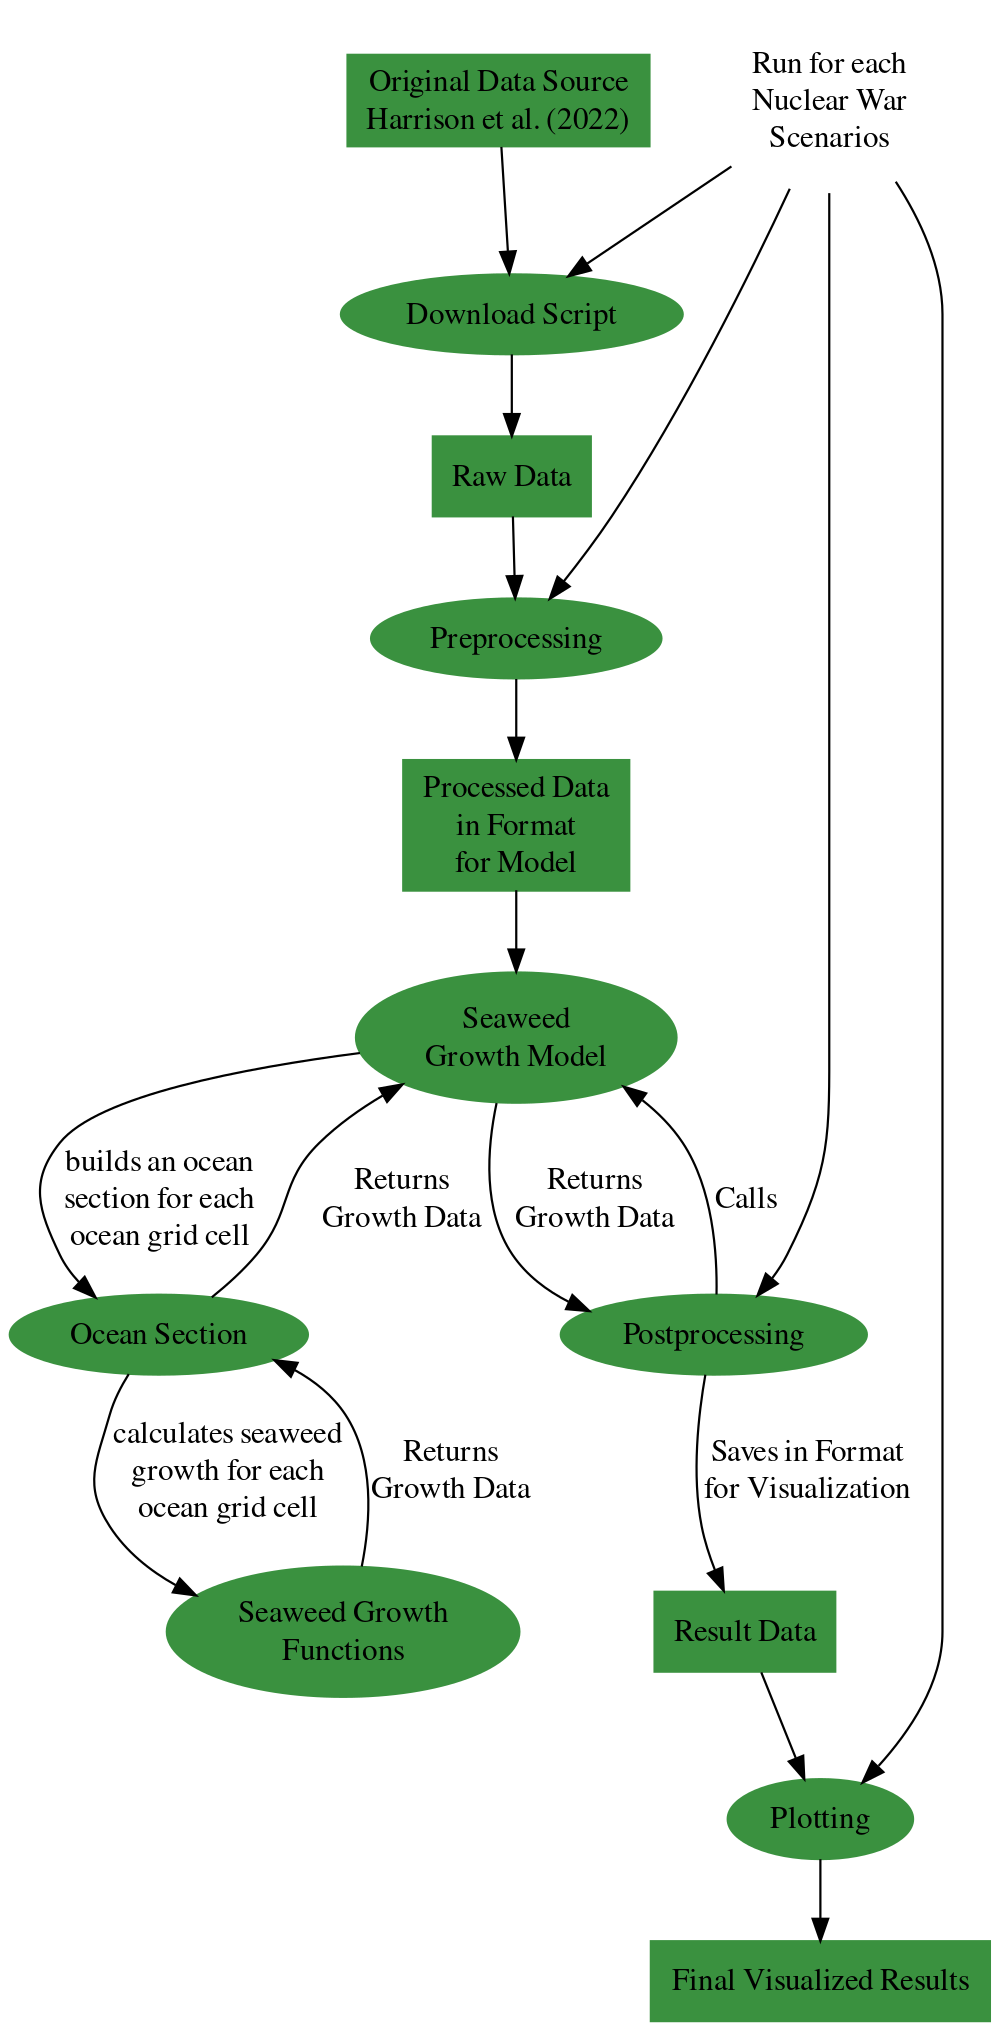
The original data source is from Harrison et al. (2022). The files provided here are a subset of the total dataset. The script on how the data was downloaded from the original source can be found here.
The code in this repository is split into three parts:
The code for the actual model can be found in the model folder. It consists of three files:
-
seaweed_growth.py: The equations of the empirical seaweed model by James and Boriah (2010). It can either do this for a single value or for a complete pandas series of values. -
ocean_section.py: Meant to represent a section of the ocean. It is agnostic about the size of this section. So, it can be either a grid cell or a large marine ecosystem. -
seaweed_model.py: Interface to actually run the model. It reads in the data you provide it with, calculates the seaweed growth rate and saves the calculation results to a file.
Mainly concerned with handling/prepping the data for and by the model.
Reads in the raw data and transforms it into a format that can be understood by the model.
Calls the model (this can also be seen as an example of usage), runs it, reads in the output of the model, clusters it using tslearn and saves it in a format more convenient for plotting.
Code to read and write files.
Makes the plots for the publication.
The following flow chart describes how different parts of this repository interact with each other and how data is transferred between them.