A small script that will allow you to check if file(s) or url(s) are considered Benford's Law "Compliant".
Warning: I am not a datascientist nor a math expert so do not consider this code as accurate as you may think (effort taken is very low here and not optimized shell calls)

Credits: https://mathworld.wolfram.com/BenfordsLaw.html
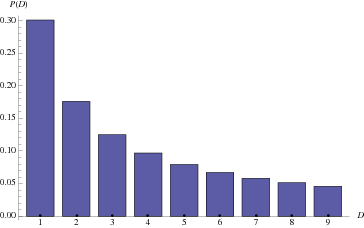
According to online resources the Benford’s law (also called the first digit law) states that the leading digits in a collection of data sets are probably going to be small.
In a nutshell, if we have a dataset containing numbers we will mostlikely find numbers starting with 1,2,3,4,5 since these will cover almost 75% of the number distribution (e.g. starting with 1 - 31% , 2 17% etc..)
This script has been tested on Linux systems and does save results on the file results-benford.csv
Checking a single URL or file
$ go run bf_checker.go https://www.mise.gov.it/images/exportCSV/prezzo_alle_8.csv
URL: https://www.mise.gov.it/images/exportCSV/prezzo_alle_8.csv
Total number of digits inside page  967037
Distribution of first digits inside the page:
1 -  47.03%
2 -  18.29%
3 -  7.42%
4 -  9.49%
5 -  7.04%
Check a list of file(s) or url(s) - must use the list.txt file
$ go run bf_checker.go  list.txt
URL: https://raw.githubusercontent.com/owid/covid-19-data/master/public/data/ecdc/locations.csv
Total number of digits inside page  650
Distribution of first digits inside the page:
1 -  13.84%
2 -  74.26%
3 -  10.17%
4 -  6.04%
5 -  7.79%

URL: https://raw.githubusercontent.com/owid/covid-19-data/master/public/data/ecdc/biweekly_cases_per_million.csv
Total number of digits inside page  114609
Distribution of first digits inside the page:
1 -  21.49%
2 -  14.24%
3 -  10.56%
4 -  8.87%
5 -  8.20%
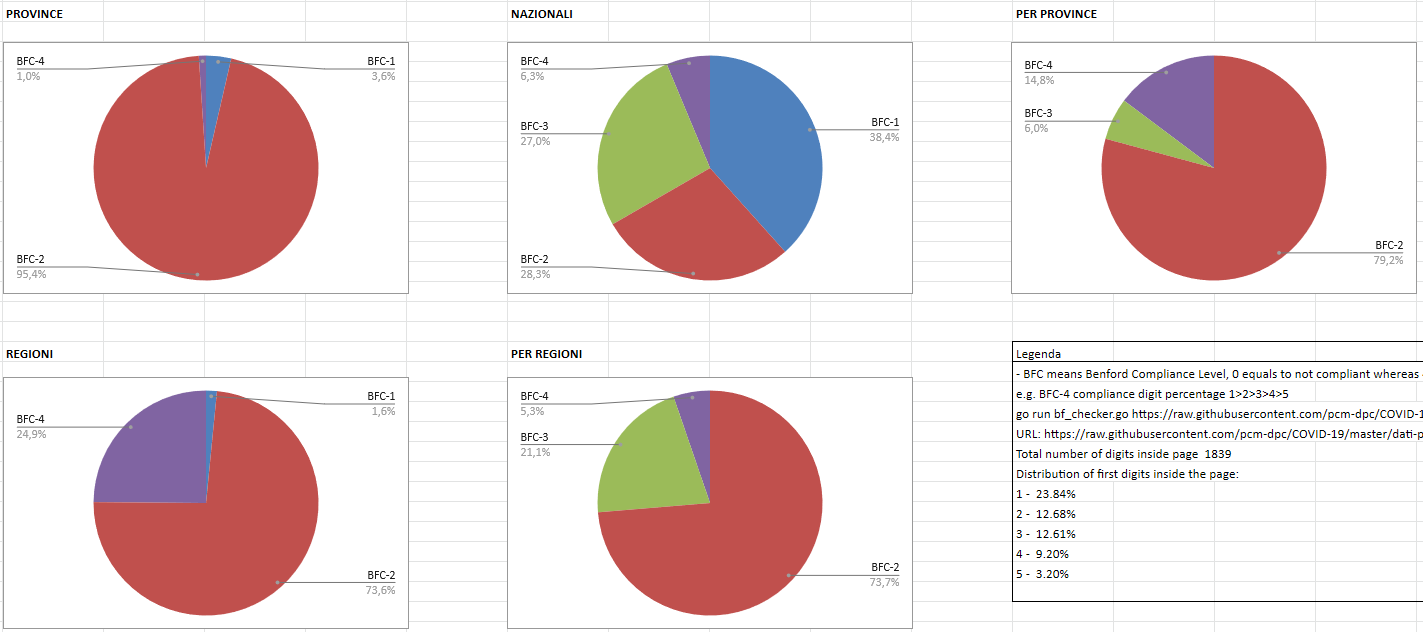
After gathering some datasets you can display your results on Google sheets and obtain some useful insights (paste the CSV on the sheet and split by comma then you can sum or use graphs):
