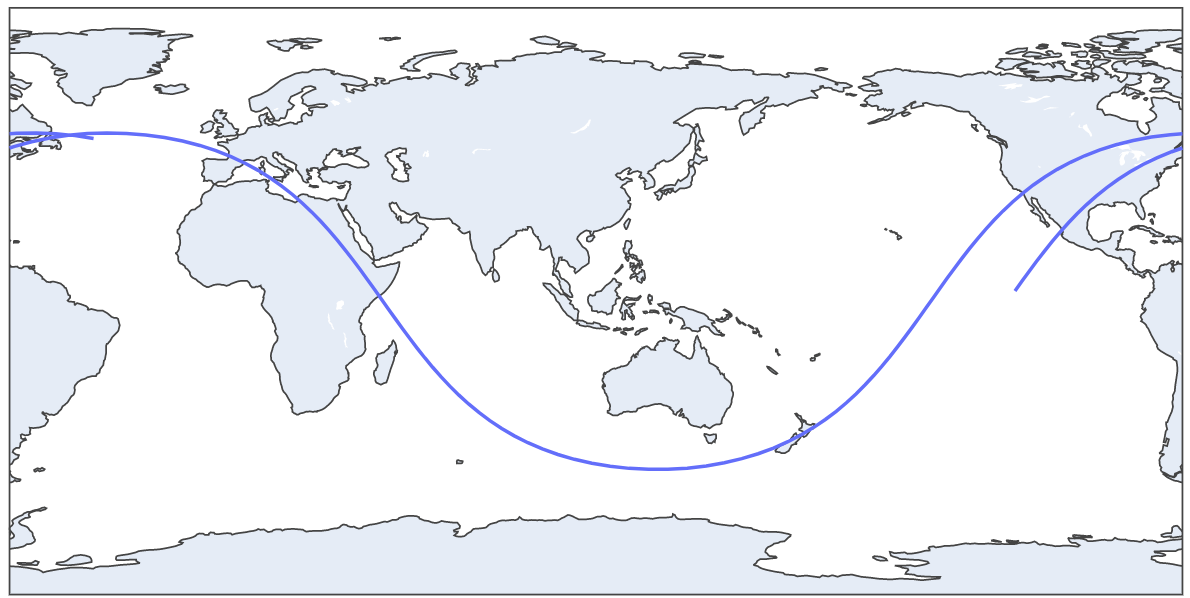
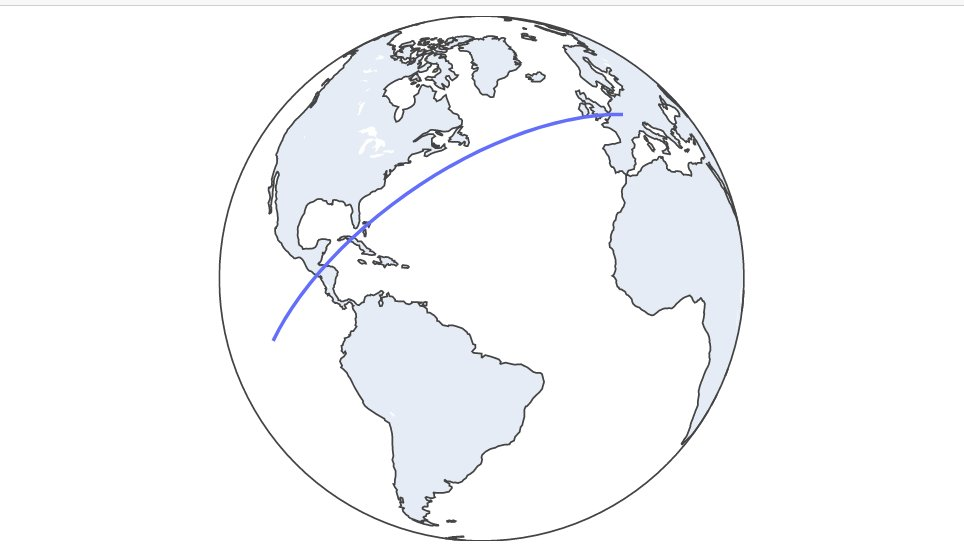
We are going to make a graph of the trajectory of the ISS that is N minutes long. The N will be chosen by the user according to their preferences. This means that the program will run and keep points in a list for N minutes.
http://open-notify.org/Open-Notify-API/ISS-Location-Now/
Pandas to read json data from ISS API, plotly to make the plot of the trajectory and time to time.sleep function
import pandas as pd
import plotly.express as px
import time
Second we must initialize the list that will preserve the latitude and longitude points (every sixty seconds). You also have to initialize the N variable with time in minutes
latitudes = []
longitudes = []
N = 60 # Sixty for one hour trajectory
Then we will create the following for loop to keep recording latitude-longitude points separated by one minute
We use for i in range(N), which is the time that the script will keep running (in hours) because we have a time.sleep(60) at the end
for i in range(N):
    url = "http://api.open-notify.org/iss-now.json" # API URL

    df = pd.read_json(url) # Pandas read JSON data from API

    latitudes.append(df["iss_position"]["latitude"])  # We append latitude ISS position to latitudes list
    longitudes.append(df["iss_position"]["longitude"]) # We append longitude ISS position to longitudes list

    time.sleep(60) # This is used to separate de point records with one minute
When the for loop finish the iterating we will have a record of N minutes ISS trajectory. Now we can plot this with Plotly (px.line_geo):
fig = px.line_geo(lat=latitudes, lon=longitudes) # Passing our latitudes and longitudes list as parameter
fig.show() fig.update_geos(projection_type="orthographic")
fig.update_layout(height=300, margin={"r":0,"t":0,"l":0,"b":0})
fig.show() We will estimate the ISS velocity using two diferent latitude-longitude points separated by one minute (sixty seconds). We can get the distance between that two points and then use phisics formula velocity(m/s) = distance(in meters)/time(in seconds)
import pandas as pd # Pandas to read API data
import time # Time for time.sleep
import geopy.distance # Geopy to get distance between two lat-lon points
import requests # Get another API data
import json # Read that datalat = []
long = []Next we will use a for loop to get the two latitude-longitude points separated by 60 seconds (time.sleep(60))
for i in range(2):  # for in range(2) because we want two lat-lon points

    url = "http://api.open-notify.org/iss-now.json" # API url

    df = pd.read_json(url) # Read API Json data with Pandas

    lat.append(df["iss_position"]["latitude"]) # Append latitude to lat list
    long.append(df["iss_position"]["longitude"]) # Append longitude to long list

    time.sleep(60) # Wait 60 seconds to record the second lat-lon point
When this for loop finish we will have a lat list with two latitude positions and one long list with two longitude positions. In conjuntion of this 4 numbers we have two lat-lon points in different time moments (separated by one minute)
We create the two different points. The first one with lat[0] index and long[0]. The second one with lat[1] and long[0]
coords_1 = (lat[0], long[0])
coords_2 = (lat[1], long[1])distance = (
geopy.distance.distance(coords_1, coords_2).m
) # Distance between the points in metersBut we must make a litle correction. Because ISS isn't moving in earth surface. It's orbiting aproximately 400Km above earth surface. So the radius is greater. The distance traveled is a litle bit more. To do this, we need to get ISS current altitud. Use the following code:
iss_alt_url = "https://api.wheretheiss.at/v1/satellites/25544"
r = requests.get(iss_alt_url)
r = r.text
r = json.loads(r)

iss_alt = int(r["altitude"]) # IN KMearth_radius = 6371 # in KM
distance_corrected = (distance * (earth_radius+iss_alt)/earth_radius)speed = distancia_corrected/60
print(round(speed*3.6, 3), "KM/H") # Multiplied by 3.6 to convert from m/s to km/h. Rounded by 3.26367.118 KM/h
A body in elliptical orbit around another of greater mass moves at minimum orbital speed when it is in its apoaster (apogee for a body in orbit around the Earth) and at maximum orbital speed when it is in its periaster 1 ( perigee for a body in orbit around the Earth) because, according to Kepler's second law, in its travel through the ellipse the body sweeps equal areas in equal times.
We will use the database_api that i included in this repository. It include 300 minutes os ISS Data.
import pandas
matrixpandas = pandas.read_csv("dataset_api.csv")import plotly.express as px
print("Un cuerpo en órbita elíptica alrededor de otro de mayor masa se mueve a la mínima velocidad orbital cuando se encuentra en su apoastro (apogeo para un cuerpo en órbita alrededor de la Tierra) y a la máxima velocidad orbital cuando se encuentra en su periastro 1 (perigeo para un cuerpo en órbita alrededor de la Tierra) debido a que, según la segunda ley de Kepler, en su recorrido por la elipse el cuerpo barre áreas iguales en tiempos iguales.")
fig = px.line(matrixpandas, x="time_utc", y="velocity_api", title='ISS Velocity cycle')
fig.show()
fig = px.line(matrixpandas, x="time_utc", y="altitude", title='ISS Altitude cycle')
fig.show()It is demonstrated that the body that orbits elliptically (ISS) to another body of greater mass (Earth) reaches its minimum orbital speed at its apoaster. And its higher orbital speed in its periaster.
ISS data - 2021 - Made by Facundo Pedaccio


