This project has been completely replaced by the supla-virtual-device.
Go there for installation and running instructions.
This readme still serves as a source of ideas of what you can save to a file and display in SUPLA.
You need to find a way of putting meaningful numbers into the files mentioned in the channels configuration. Thay can come from anywhere and mean anything. It's totally up to you.
I will post some examples here just to make you aware of what and how can be accomplished. But the main idea often boils down to one of these patterns:
- get the value periodically at specific intervals; this involves executing your command that puts new values in monitored values with cron
- get the value continously with a process that is constantly run; such process should be configured
similarily to the
supla-devorsupla-filesensorswithinit.dorsupervisor; I will postsupervisorconfiguration examples below
So let's proceed with the examples!
There are plenty of public APIs that offer some interesing data you might want to display and
use in SUPLA. They are often available in JSON format so you will need a jq
tool to read them. Go ahead and install it.
sudo apt-get install jq
And explore!
Airly publishes air quality and some weather conditions as a public API. You need to generate an API key and know the coordinations of where you live and you can fetch the data it publishes, save it in a file... And display in SUPLA :-)
See an example URL (it will not work because of invalid API Key):
https://airapi.airly.eu/v2/measurements/nearest?lat=51.038900&lng=19.13251&maxDistanceKM=10&apikey=CBKndj3UVtGpAGlmLFiAL4wLekYo
Change the coordinates and API Key to your data and see the output. You can easily consume it and save the PM10 and PM2.5 values in a file with the following crontab:
*/10 * * * * (AIRLY_DATA=$(curl -s 'https://airapi.airly.eu/v2/measurements/nearest?lat=51.038900&lng=19.13251&maxDistanceKM=10&apikey=CBKndj3UVtGpAGlmLFiAL4wLekYo') && echo $AIRLY_DATA | jq '.current.values[] | select(.name=="PM10") | .value' && echo $AIRLY_DATA | jq '.current.values[] | select(.name=="PM25") | .value') > /home/pi/airly.txt
Syngeos like Airly, publish data on air quality, pressure etc. There is no need to generate an API key here. All you have to do is go to the page Syngeos Map and select the sensor you are interested in. An example for Wojkowice:
https://panel.syngeos.pl/sensor/pm10?device=187
Add the crontab below and change the final digit of the address (187) to the sensor of your choice
*/10 * * * * (SYNGEOS_DATA=$(curl -s 'https://api.syngeos.pl/api/public/data/device/187') && echo $SYNGEOS_DATA | jq '.sensors[4] | select(.name=="pm10") | .data[0].value' && echo $SYNGEOS_DATA | jq '.sensors[3] | select(.name=="pm2_5") | .data[0].value') > /home/pi/syngeos-air.txt
For atmospheric pressure:
*/10 * * * * (SYNGEOS_DATA=$(curl -s 'https://api.syngeos.pl/api/public/data/device/187') && echo $SYNGEOS_DATA | jq '.sensors[2] | select(.name=="air_pressure") | .data[0].value') > /home/pi/syngeos-pressure.txt
It's quite easy to get forecast info with OpenWeatherMap API. You need to sign in and get your APP ID, but then you are good to go and consume the API. For example, you can display the anticipated temperature that will be at your location in e.g. 6 hours with the 5 days forecast endpoint.
0 0 * * * curl -s 'http://api.openweathermap.org/data/2.5/forecast?q=Paczków,pl&units=metric&appid=YOUR_API_KEY' | jq '.list[1].main.temp'
How many commits SUPLA developers made in the last week? Are they working at all?
0 0 * * * curl -s 'https://api.github.com/repos/SUPLA/supla-cloud/stats/commit_activity' | jq '.[0].total' > /home/pi/supla-progress.txt
In order to consume HTML/XML output nicely, it's good idea to use CSS selectors. Luckily, there is
a pup tool that offers CSS selectors in command line. Go to the pup releases
and download a binary suitable for your machine. It is also a good idea to move it to /usr/bin
so it is globally available as pup command. For example, for Raspberry, it would be:
sudo apt-get install unzip
wget https://github.com/ericchiang/pup/releases/download/v0.4.0/pup_v0.4.0_linux_arm.zip -O pup.zip
unzip pup.zip
sudo mv pup /usr/bin
rm pup.zip
The exchange rate is for example available on https://internetowykantor.pl/kurs-euro/.
Looking at the HTML, the interesting part is:
<span class="kurs kurs_sprzedazy">4,2828</span>So we can get this with pup and save it in a file for supla-filesensors every hour:
0 0 * * * curl -s 'https://internetowykantor.pl/kurs-euro/' | pup '.kurs_sprzedazy text{}' | sed 's/,/./' > /home/pi/exchange_rate.txt
Also notice how the sed is used to replace comma , to dot . so the SUPLA is not confused with the number format.
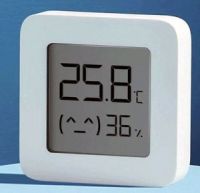
For this you need to have a Bluetooth module on the device you run this program (seems obvious right?). Raspberry Pi Zero W is considered to have very decent Bluetooth range.
In order to get measurements from any Bluetooth sensor you need to find out it's MAC address. Therefore, it might be a good idea to start with finding it:
sudo hcitool lescan
Download LYWSD03MMC.py script from https://github.com/JsBergbau/MiTemperature2 and
install all of its prerequisites.
Then use it to save the readings to a file. Use this file to send values to the SUPLA pretending it is
a DHT-22 sensor.
Example installation:
mkdir mi-temp
cd mi-temp
wget https://raw.githubusercontent.com/JsBergbau/MiTemperature2/master/LYWSD03MMC.py
echo '#!/bin/bash' > save-fo-file.sh
echo 'echo $3 > sensor_$2.txt' >> save-fo-file.sh
echo 'echo $4 >> sensor_$2.txt' >> save-fo-file.sh
chmod +x LYWSD03MMC.py save-fo-file.sh
And then read its measurements:
./LYWSD03MMC.py --device A4:C1:38:2B:99:64 --round --debounce --name mysensor --callback save-fo-file.sh
The terminal should show you the measurements repeatedly. Stop it with Ctrl+C.
Take a look at the sensor_mysensor.txt file. It should contain measurements last seen by the script in two lines.
Add a TEMPERATURE_AND_HUMIDITY channel in supla-filesensors.cfg pointing at the resulting file.
Last but not least, add the following configuration to the supervisor that will take care
about running the reading script for you.
[program:mi-temp-1]
command=python3 ./LYWSD03MMC.py --device A4:C1:38:2B:99:64 --round --debounce --name mysensor --callback save-to-file.sh
directory=/home/pi/mi-temp
autostart=true
autorestart=true
user=pi
- Duplicate the
supervisorconfig for reading script with different name (e.g.[program:mi-temp-2]) - Change the
--name mysensorto something different (e.g.--name livingroom) - Add new channel in the
supla.cfgpointing at the file with the measurement name (e.g./home/pi/mi-temp/sensor_livingroom.txt) - Restart supervisor.
*/30 * * * * df -h --total / | awk '{print $5}' | tail -n 1 > /home/pi/storage.txt
I will be more than happy to accept pull requests with your ideas of what measurements we can integrate with SUPLA by using this simple tool.


