Alpha-I Plotly Surface plugin
Warning! This plugin is in develop mode.
Screenshot
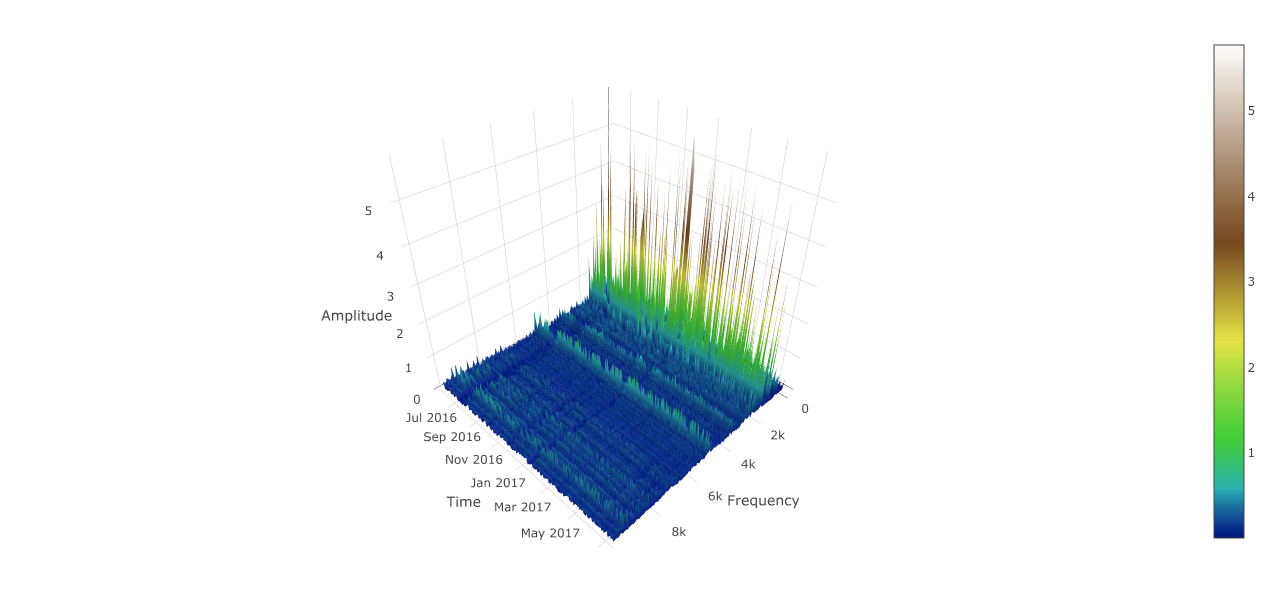
This plugin helps to visualize 3 dimensional waterfall charts. Tested on Elasticsearch datasource and with documents with this structure:
{
    "timestamp" : "2010-04-04 12:00:00",
    "x": [10, 20, 40, 80, 160],
    "y": [7, 12, 12, 16, 10],
    "unit_of_measure": "Hz"

}
This document carries a bi-dimensional data structure where the the x contains the labels for the columns and the y the values such as
y[i] is the amplitude of a signal for a x[i] unit_of_measure.
In the example, if i = 3, at the time 2010-04-04 12:00:00 at 80 Hz there is an amplitude of 16.
Contraint: x.length == y.length
Given a time range, the plugins load a list of documents lined in the Plotly Y Axis using the timestamp field.
The for a single slice, the Plotly Z Axis has the value of the document y and the Plotly Y axis has the value of the document x
Plugin options
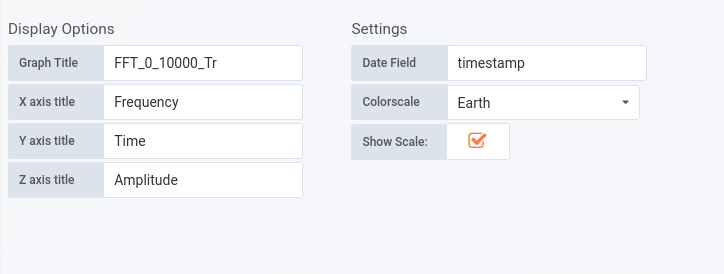
You can customize some parts of the graph going to the plugin settings tabs in edit mode.
Building
To compile, run:
npm install -g yarn
yarn install --pure-lockfile
grunt

