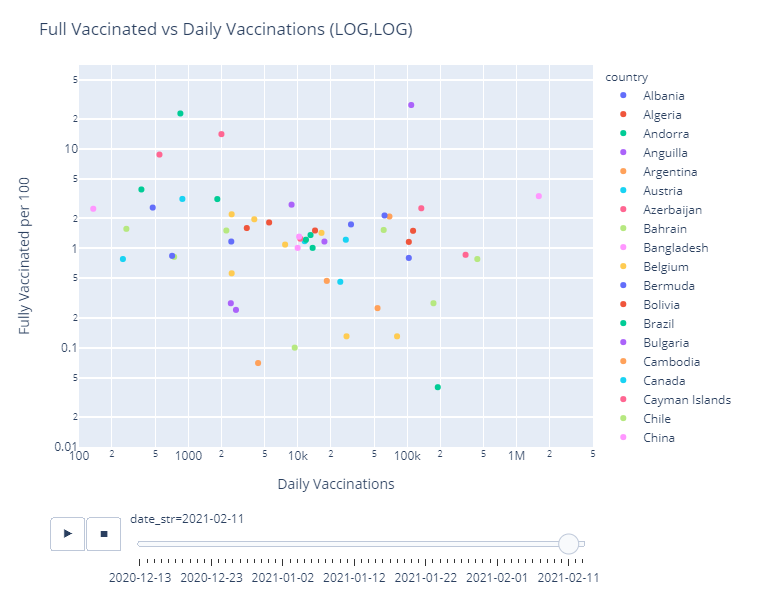
Tracking Covid vaccinations across the globe. How far have we travelled along the vaccination journey?
- Our world in Data
- Original vaccination dataset before I found our world of data This data set combines multiple data cents from the our world in data repository.
I used the Kaggle Python Container Image. It is way overkill for this task.
- Kaggle Python Container Image data science docker container to rule them all
- Any reasonable anaconda or Jupyter notebook environment your link here. You can use any Anaaconda / Jupyter Notebook environment.
- Kenny Freeman covid project that got me interested
- Our world in data
- Gabriel Preda Kaggle datsethttps://www.kaggle.com/gpreda
The included bash script will download the data and run the server.
- Open a terminal and
cdto this directory - execute
bash start-kaggle-container.shIt will- download the data
- download the docker image
- run the container and Jupyter notebook server
- Open a browser to http://localhost:8080/
- Open and run
code/vaccinations_by_country.ipynbin the Jupyter Notebook browser view in the left pane.- It will prompt you for city or state and pick the correct data file based on your prompt
-
Open a terminal and
cdto this directory -
Make a directory in this directory called
data -
Blah blah the csv files from Github and put it in
data/vaccinations.csv -
Download the global vaccination data and the us state vaccination data. This can be done from inside the notebook or the command line
curl https://covid.ourworldindata.org/data/vaccinations/vaccinations.csv -o data/vaccinations_world.csv
curl https://covid.ourworldindata.org/data/vaccinations/us_state_vaccinations.csv -o data/vaccinations_state.csv
-
Start your Jupyter server
- You can use any environment, local, docker, etc
- I use the Kaggle Python Docker image by running
bash start-kaggle-container.shin this directory. It will download the container 18GB and start the Jupyter server.
-
Open
Jupyter Notebookserver.- Open a browser to http://localhost:8080/ or wherever your notbook server is locate
- Open and run
vaccinations_by_country.ipynbin the Jupyter Notebook browser view in the left pane.
There are a couple ways to terminate the server
ctrl-cin the terminal window and answerY- Terminate the server in the Jupyter Notebook menu in the browser window
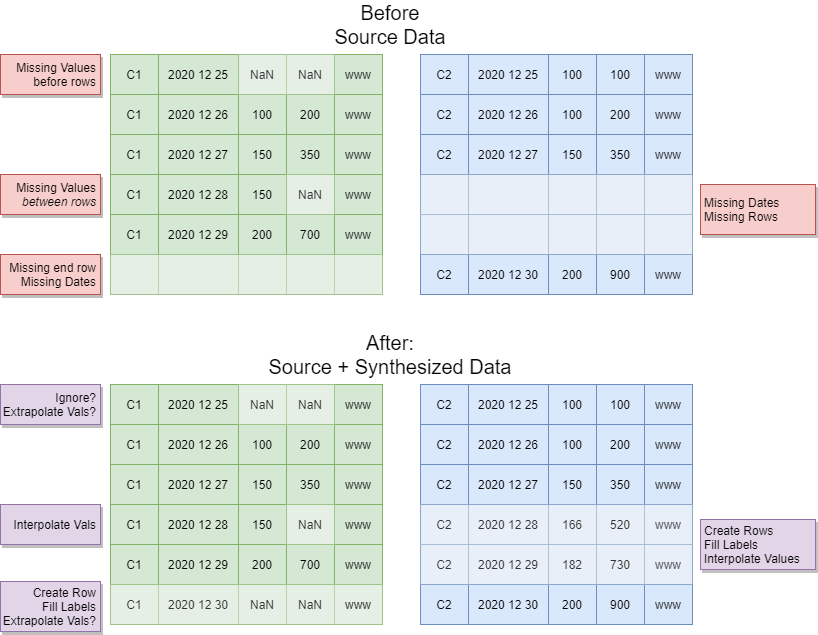
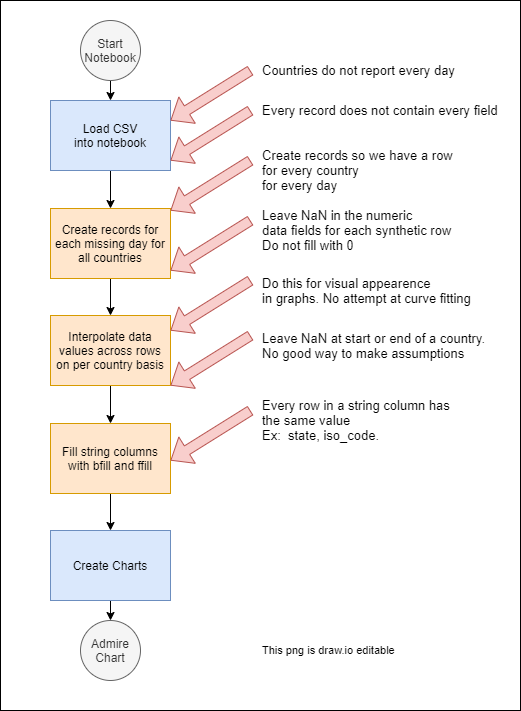
Source data may be missing days and columns
We add missing days and interpolate or fill missing cell values vaccinations_by_country.ipynb
Sample results from various data phases 19 Feb 2021 data set
| Phase | Number of Records | Daily Vaccinations (populated) | Total Vaccinations (populated) | Vaccinated per 100 (populated) |
|---|---|---|---|---|
| Initial Load | 3679 | 3542 | 2461 | 1367 |
| Post row fill | 6831 | 3432 | 2461 | 1367 |
| Post value interpolation | 6831 | 3868 | 4008 | 1837 |


